-
Type:
Problem report
-
Resolution: Unsupported version
-
Priority:
Trivial
-
None
-
Affects Version/s: 5.0.6
-
Component/s: Proxy (P)
-
Environment:net-snmp.x86_64 1:5.7.2-49.el7 @centos7-base-x86_64
net-snmp-agent-libs.i686 1:5.7.2-49.el7 @centos7-base-x86_64
net-snmp-agent-libs.x86_64 1:5.7.2-49.el7 @centos7-base-x86_64
net-snmp-devel.i686 1:5.7.2-49.el7 @centos7-base-x86_64
net-snmp-libs.i686 1:5.7.2-49.el7 @centos7-base-x86_64
net-snmp-libs.x86_64 1:5.7.2-49.el7 @centos7-base-x86_64
net-snmp-perl.x86_64 1:5.7.2-49.el7 @centos7-base-x86_64
net-snmp-utils.x86_64 1:5.7.2-49.el7 @centos7-base-x86_64
zabbix-agent.x86_64 5.0.7-1.el7 @zabbix5.0
zabbix-proxy-mysql.x86_64 5.0.7-1.el7 @zabbix5.0
zabbix-release.noarch 5.0-1.el7 @zabbix4.0net-snmp.x86_64 1:5.7.2-49.el7 @centos7-base-x86_64 net-snmp-agent-libs.i686 1:5.7.2-49.el7 @centos7-base-x86_64 net-snmp-agent-libs.x86_64 1:5.7.2-49.el7 @centos7-base-x86_64 net-snmp-devel.i686 1:5.7.2-49.el7 @centos7-base-x86_64 net-snmp-libs.i686 1:5.7.2-49.el7 @centos7-base-x86_64 net-snmp-libs.x86_64 1:5.7.2-49.el7 @centos7-base-x86_64 net-snmp-perl.x86_64 1:5.7.2-49.el7 @centos7-base-x86_64 net-snmp-utils.x86_64 1:5.7.2-49.el7 @centos7-base-x86_64 zabbix-agent.x86_64 5.0.7-1.el7 @zabbix5.0 zabbix-proxy-mysql.x86_64 5.0.7-1.el7 @zabbix5.0 zabbix-release.noarch 5.0-1.el7 @zabbix4.0
Hi,
we are monitoring a lot of snmpv3 devices with this zabbix proxy and have some issues with flapping snmp availability. After some troubleshooting I discovered that zabbix seams to switch the snmpEngineTime to unknown/unpredictable/wrong values, which causes the devices to be not stable.
I monitored all our traffic with wireshark on this poxy and I am sure there are no duplicate snmpEngineIDs. (Doublechecked)
Steps to reproduce:
- Monitor a lot of different snmpv3 devices from a zabbix proxy.
- Make sure to use more than 1 Poller. Our StartPollers value is 75.
- Make sure to have unique snmp engineIDs in the whole network. I checked this with wireshark.
- Wait for flapping snmp connectivity triggers
- Create a tcpdump of all snmp traffic on the proxy and analyze snmp communication.
Result:
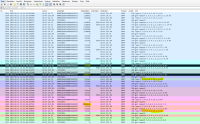
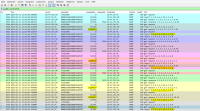
Flapping snmp availability of the devices, because Zabbix uses the wrong snmpEngineTime Values as you can see in the screenshots. If you have a look in the "snmp_usmStatsNotInTimeWindows_allpackets.png" you will see, that there is no communication to other devices happening in the exact moment zabbix switches to the wrong snmpEngineTime. The "allpackets" screenshot shows you all snmp traffic on this machine. It seem zabbix switches to the wrong snmpEngineTime without reason and communication starts to get worse. The monitored device correctly reports usmStatsNotInTimeWindows, but zabbix seems not to care about. Further it seems that requests happen in parallel with correct and wrong snmpEngineTime. I guess this is because zabbix uses several poller to request the device, but only one poller uses the correct snmpEngineTime.
Expected:
No flapping snmp availability and zabbix proxy is using the correct snmpEngineTime for communication.

