-
Type:
Problem report
-
Resolution: Fixed
-
Priority:
 Trivial
-
Affects Version/s: 5.0.12rc1, 5.2.7rc1
-
Component/s: Frontend (F)
-
None
-
Sprint 76 (May 2021), Sprint 77 (Jun 2021), Sprint 78 (Jul 2021), Sprint 79 (Aug 2021), Sprint 80 (Sep 2021), Sprint 81 (Oct 2021), Sprint 82 (Nov 2021), Sprint 83 (Dec 2021), Sprint 84 (Jan 2022), Sprint 85 (Feb 2022), Sprint 86 (Mar 2022), Sprint 87 (Apr 2022), Sprint 88 (May 2022), Sprint 89 (Jun 2022), Sprint 90 (Jul 2022), Sprint 91 (Aug 2022)
-
1
Steps to reproduce:
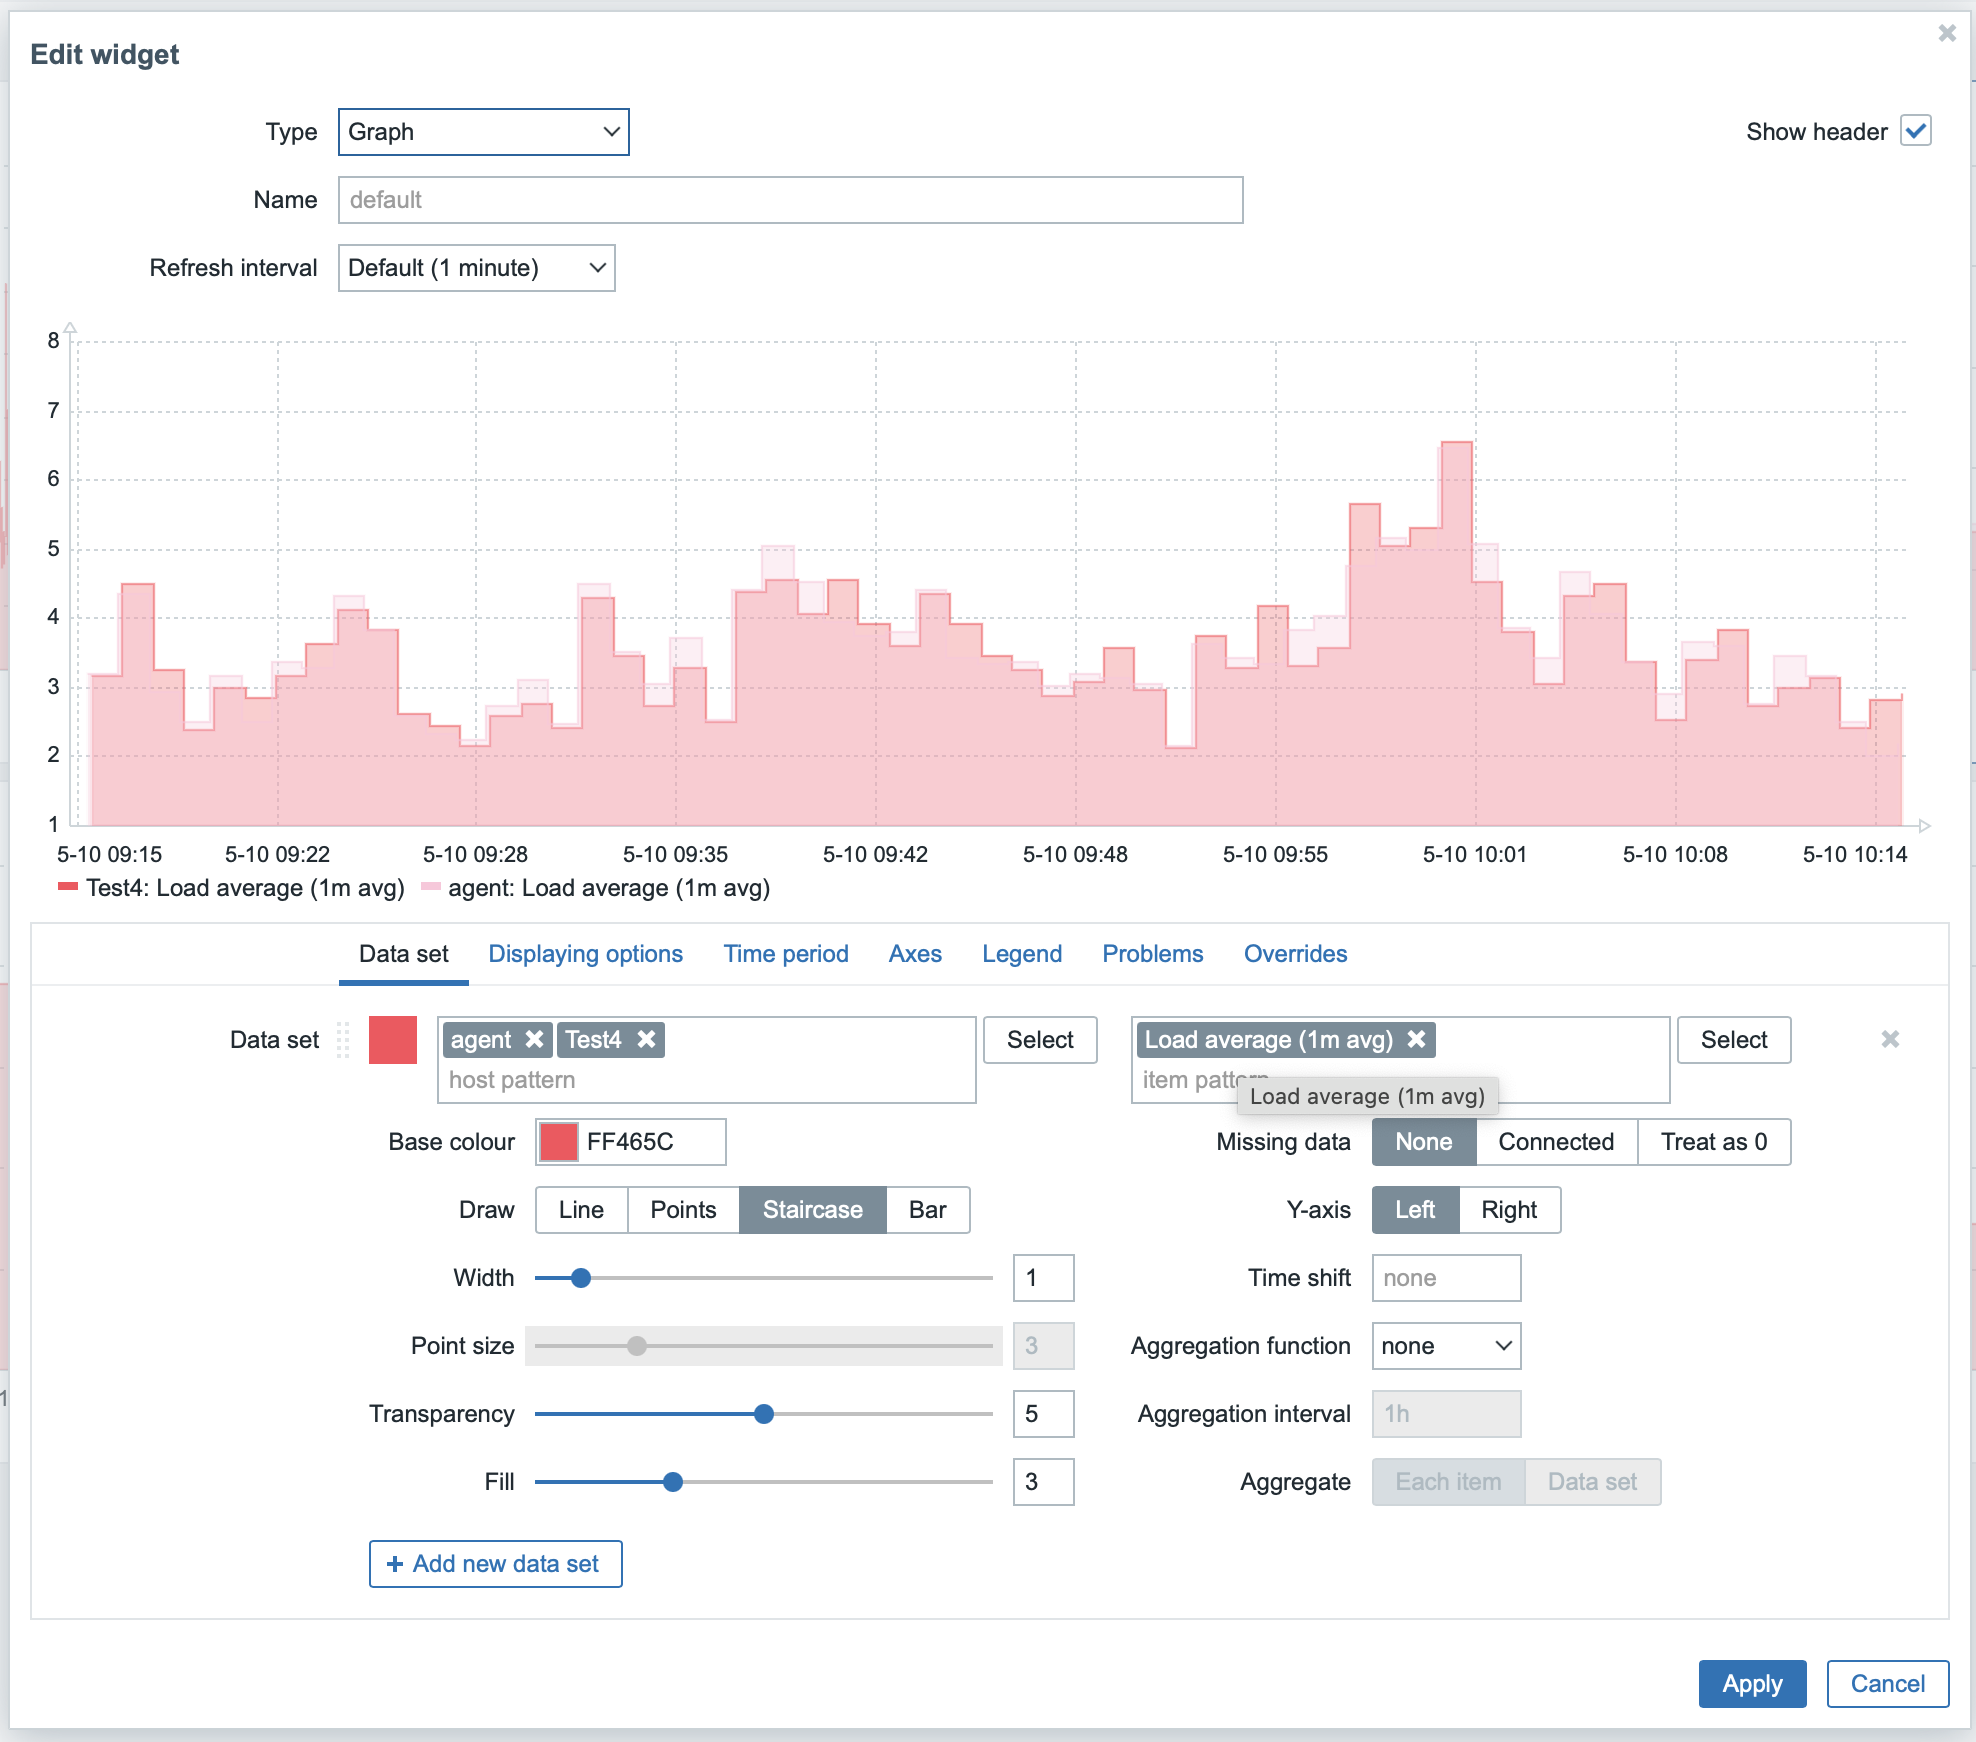
1) we have simple graph for two hosts for item load average 1 min (with standard linux template by agent)

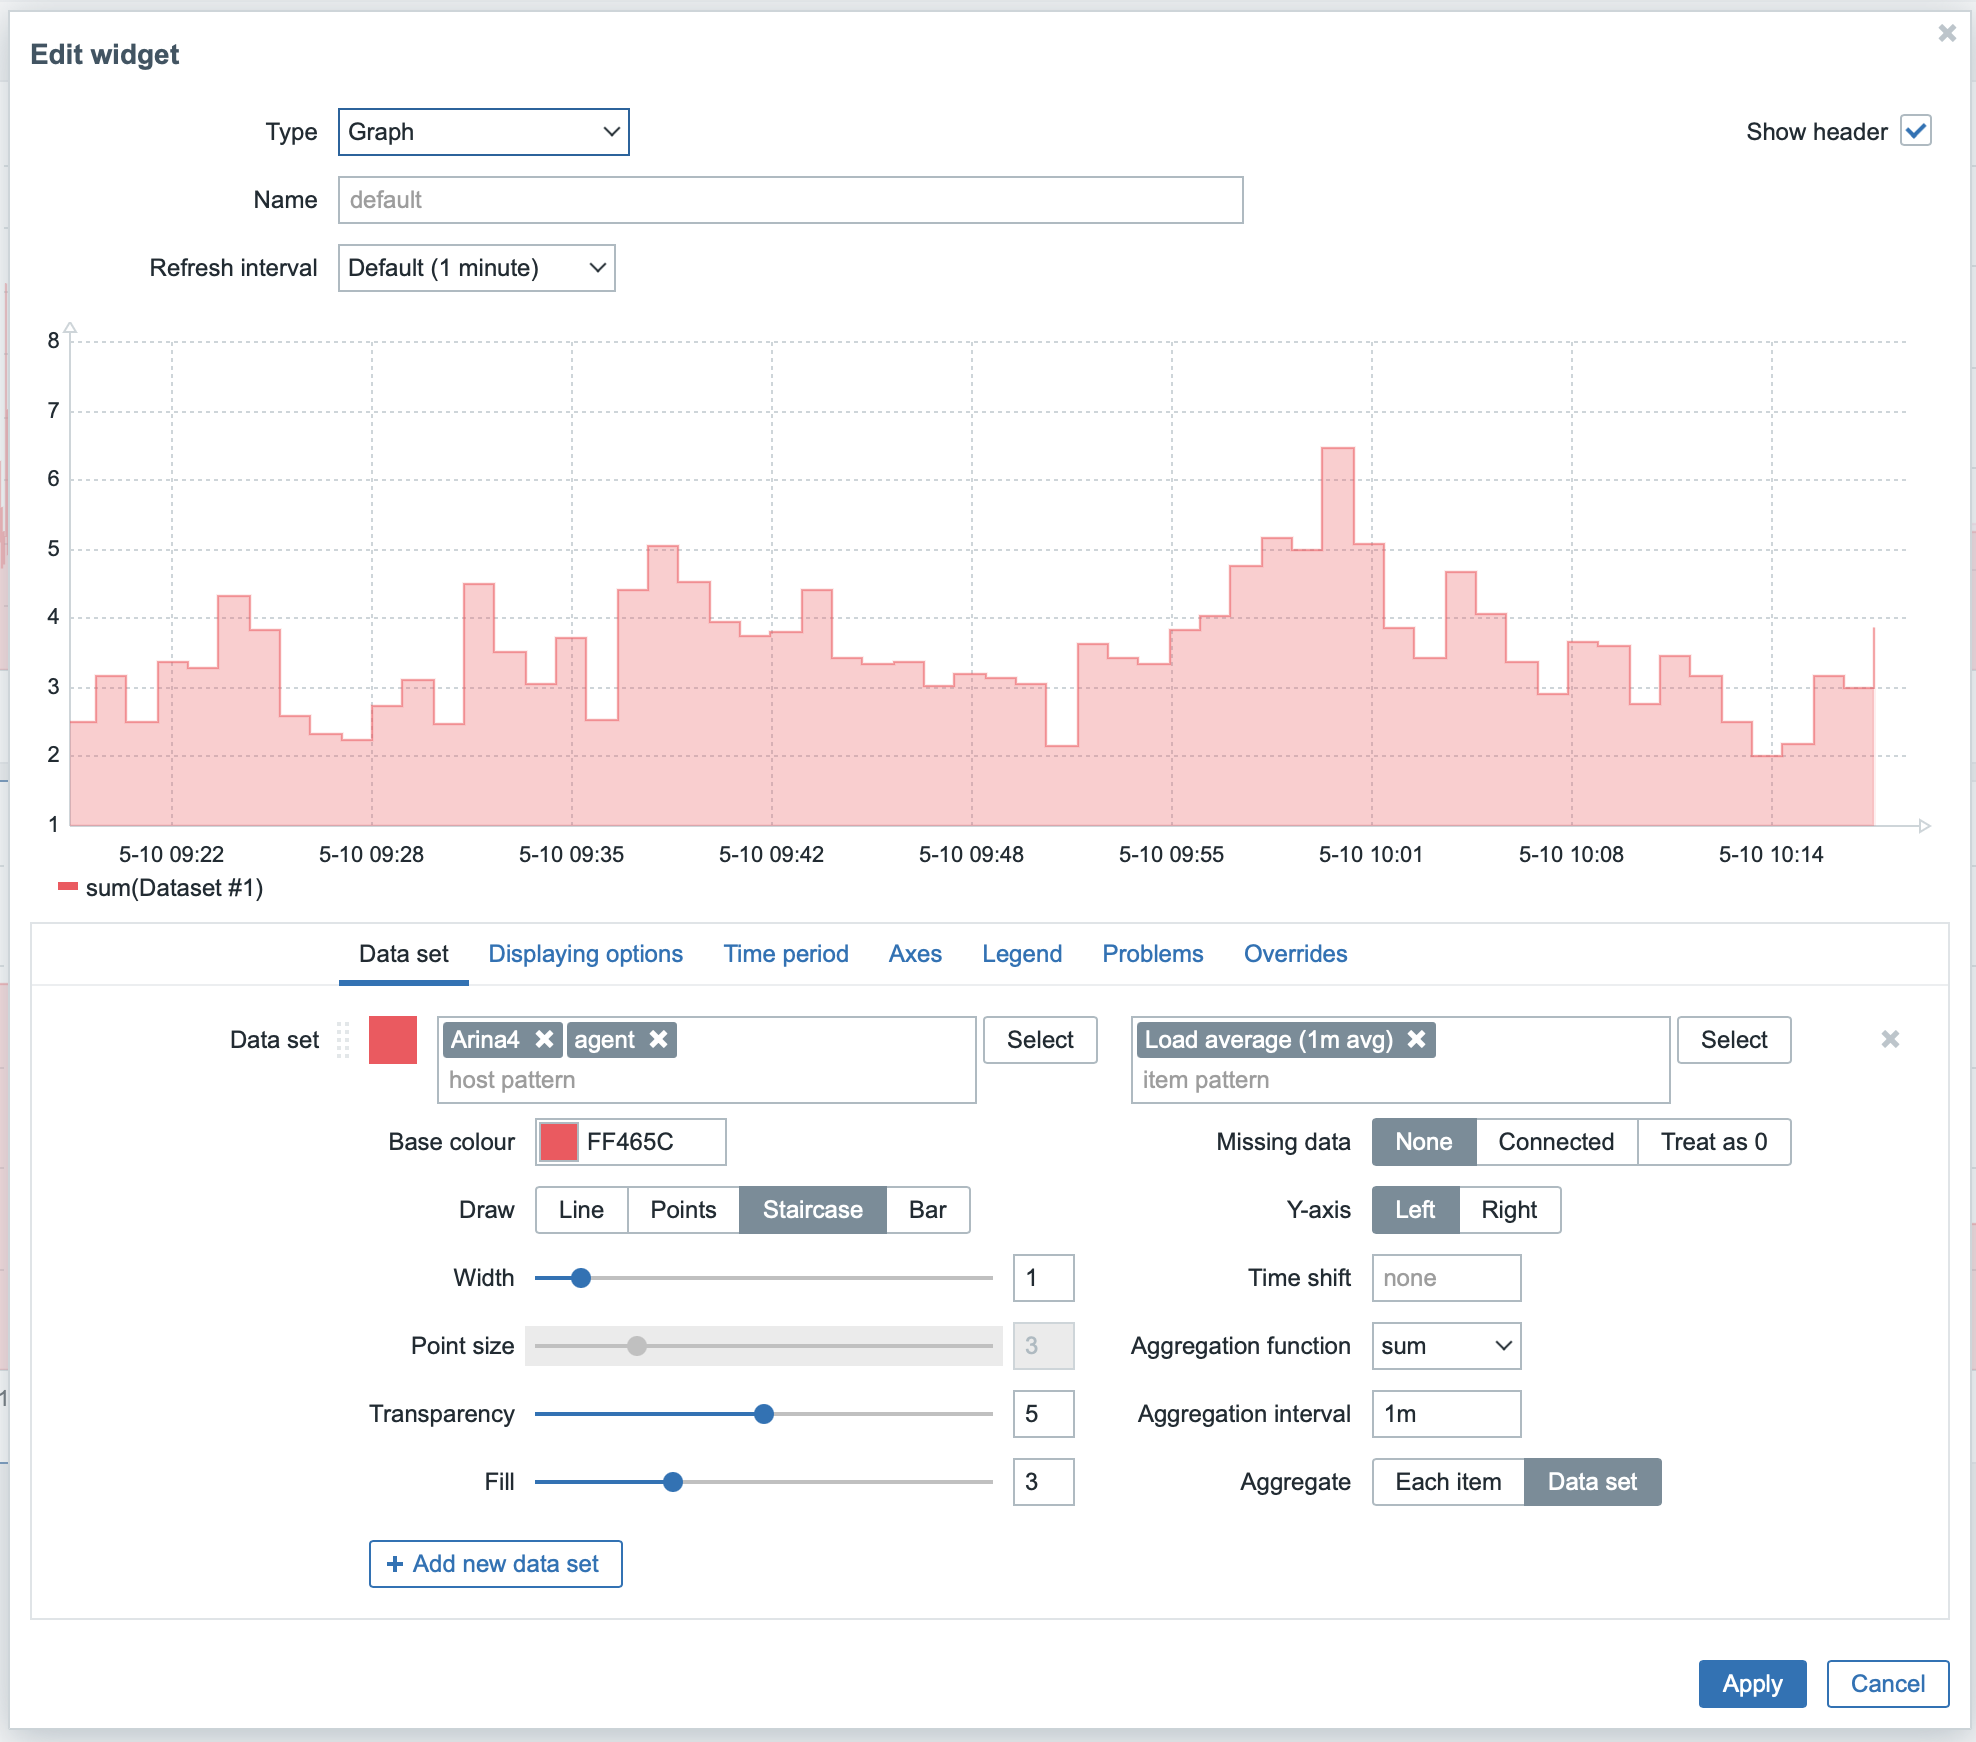
2) add one copy of widget where we add sum function for 1 min and dataset.

So when we open this widgets for period less that 1 day all file. Otherwise we have weird values. If set get data from history but display option it calculated fine. As well if we use avg,min,max
Result:
So final dashboard looks like this.

Expected:
I expected to have very close values for top left graph but from trends.