-
Type:
Incident report
-
Resolution: Unresolved
-
Priority:
 Trivial
-
None
-
Affects Version/s: 5.0.11, 5.2.6, 5.4.0rc1
-
Component/s: Templates (T)
-
None
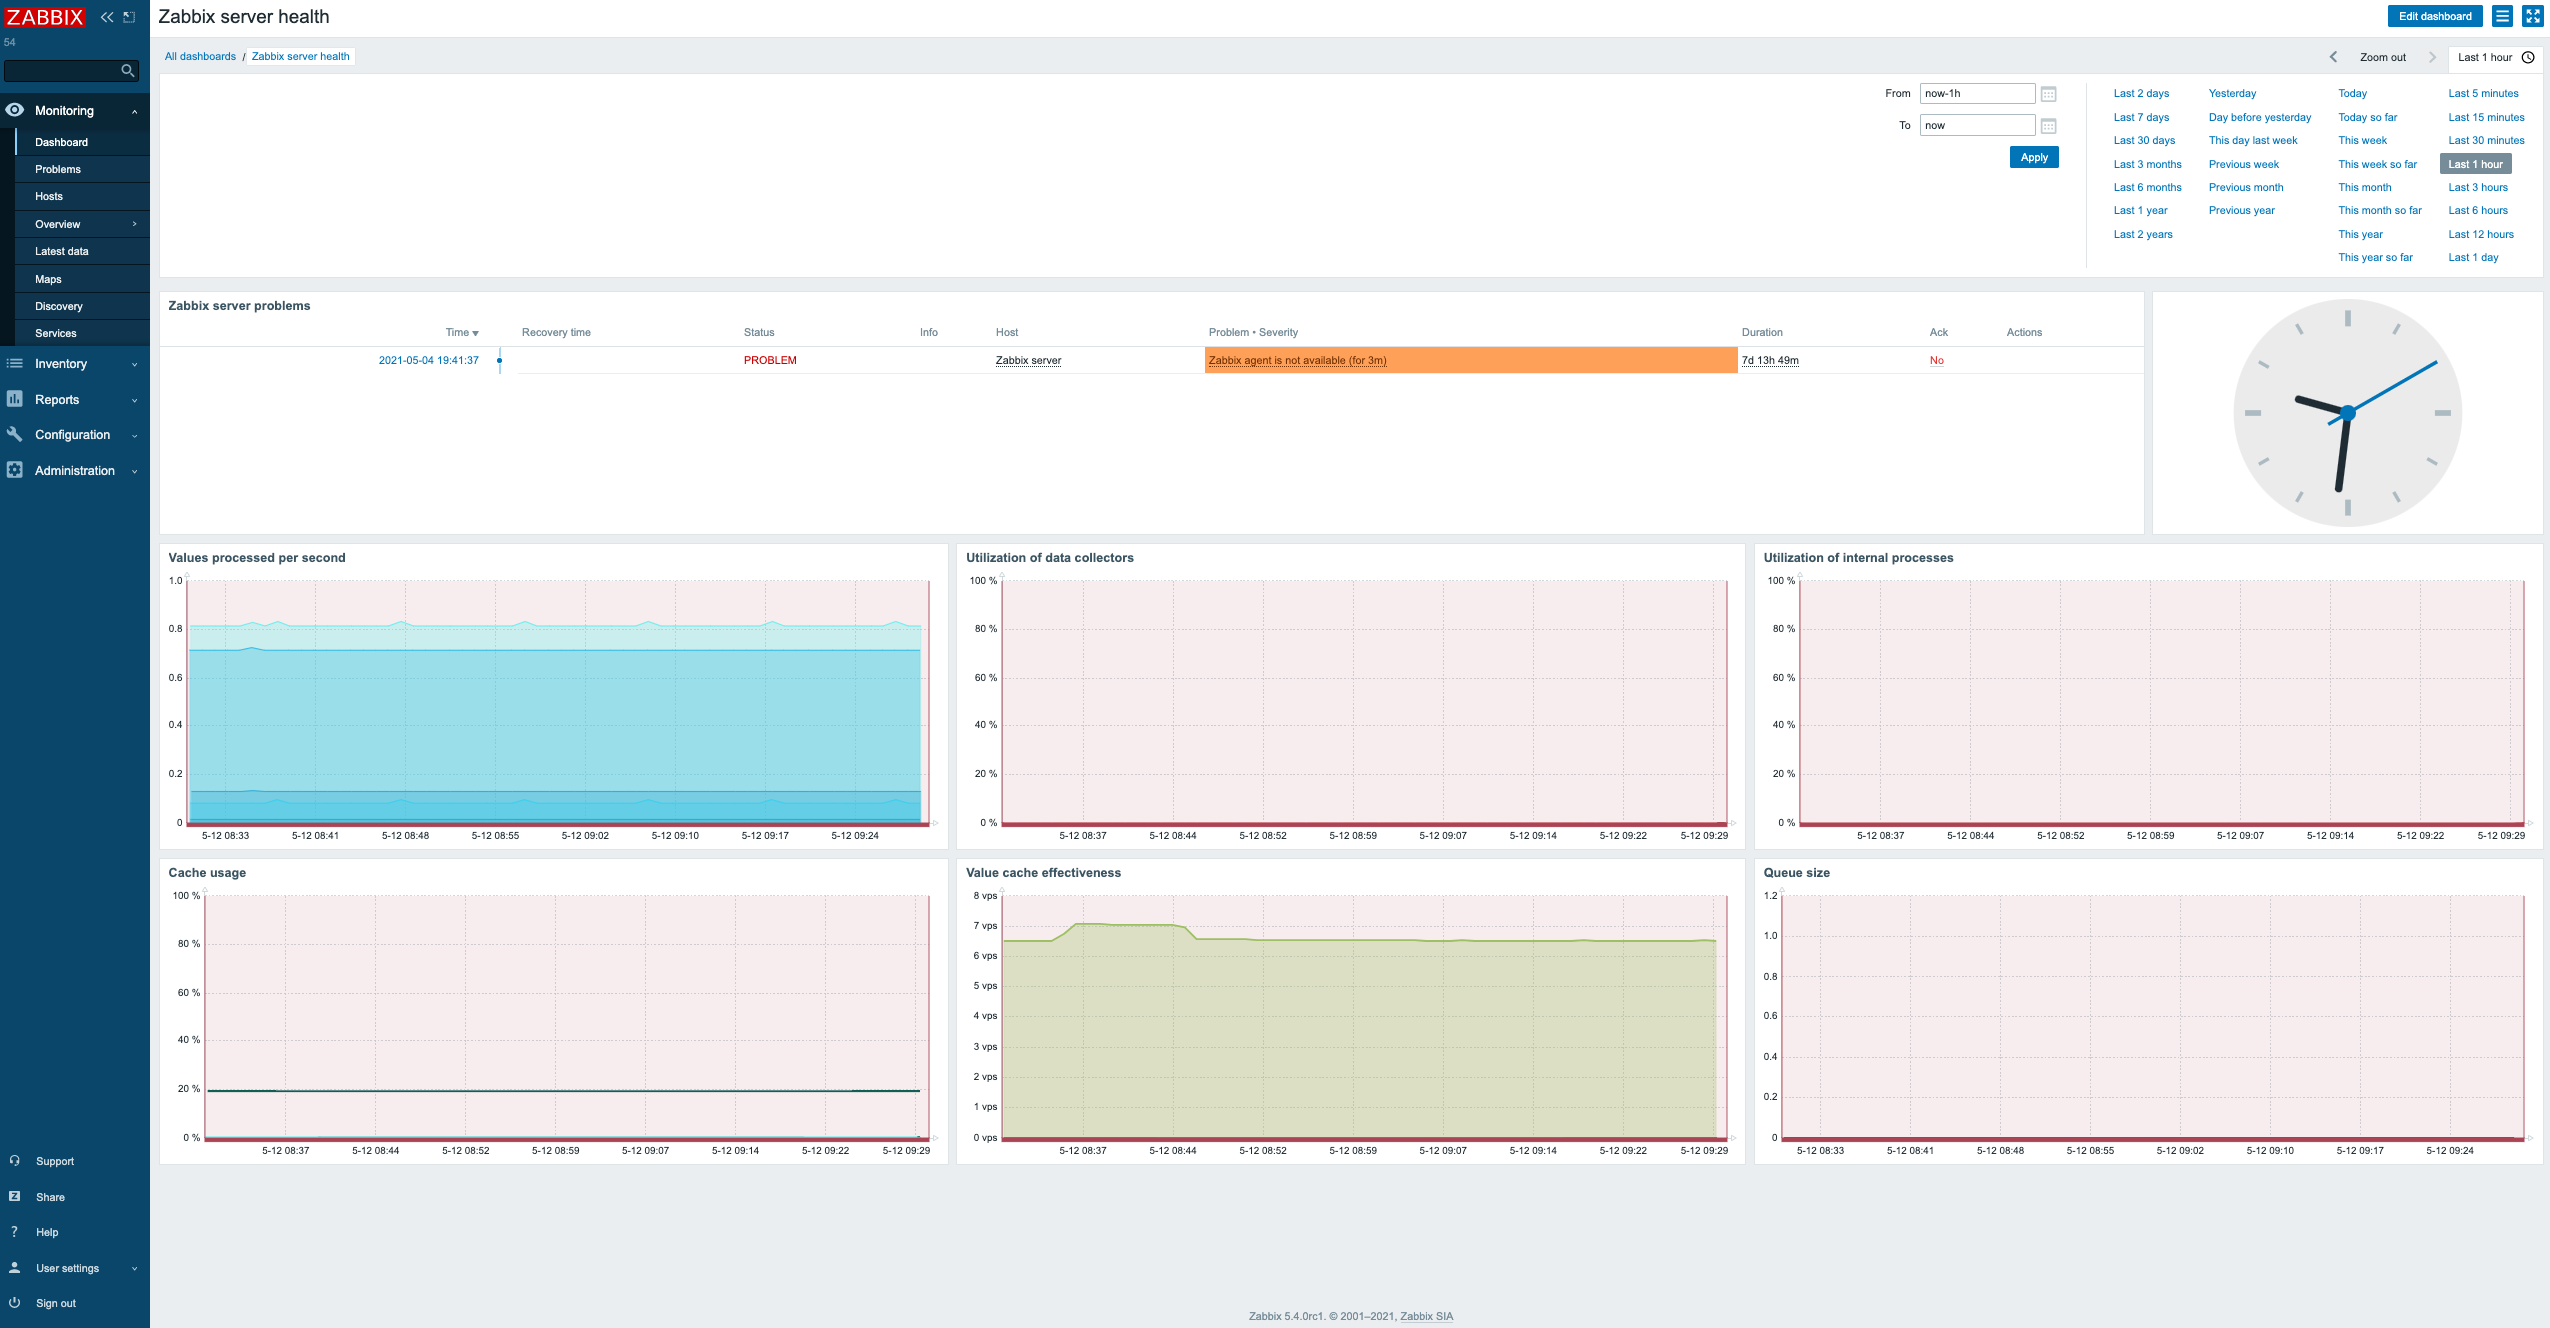
In browser 1: Go to Monitoring -> Dashboards and open dashboard "Zabbix Server health".
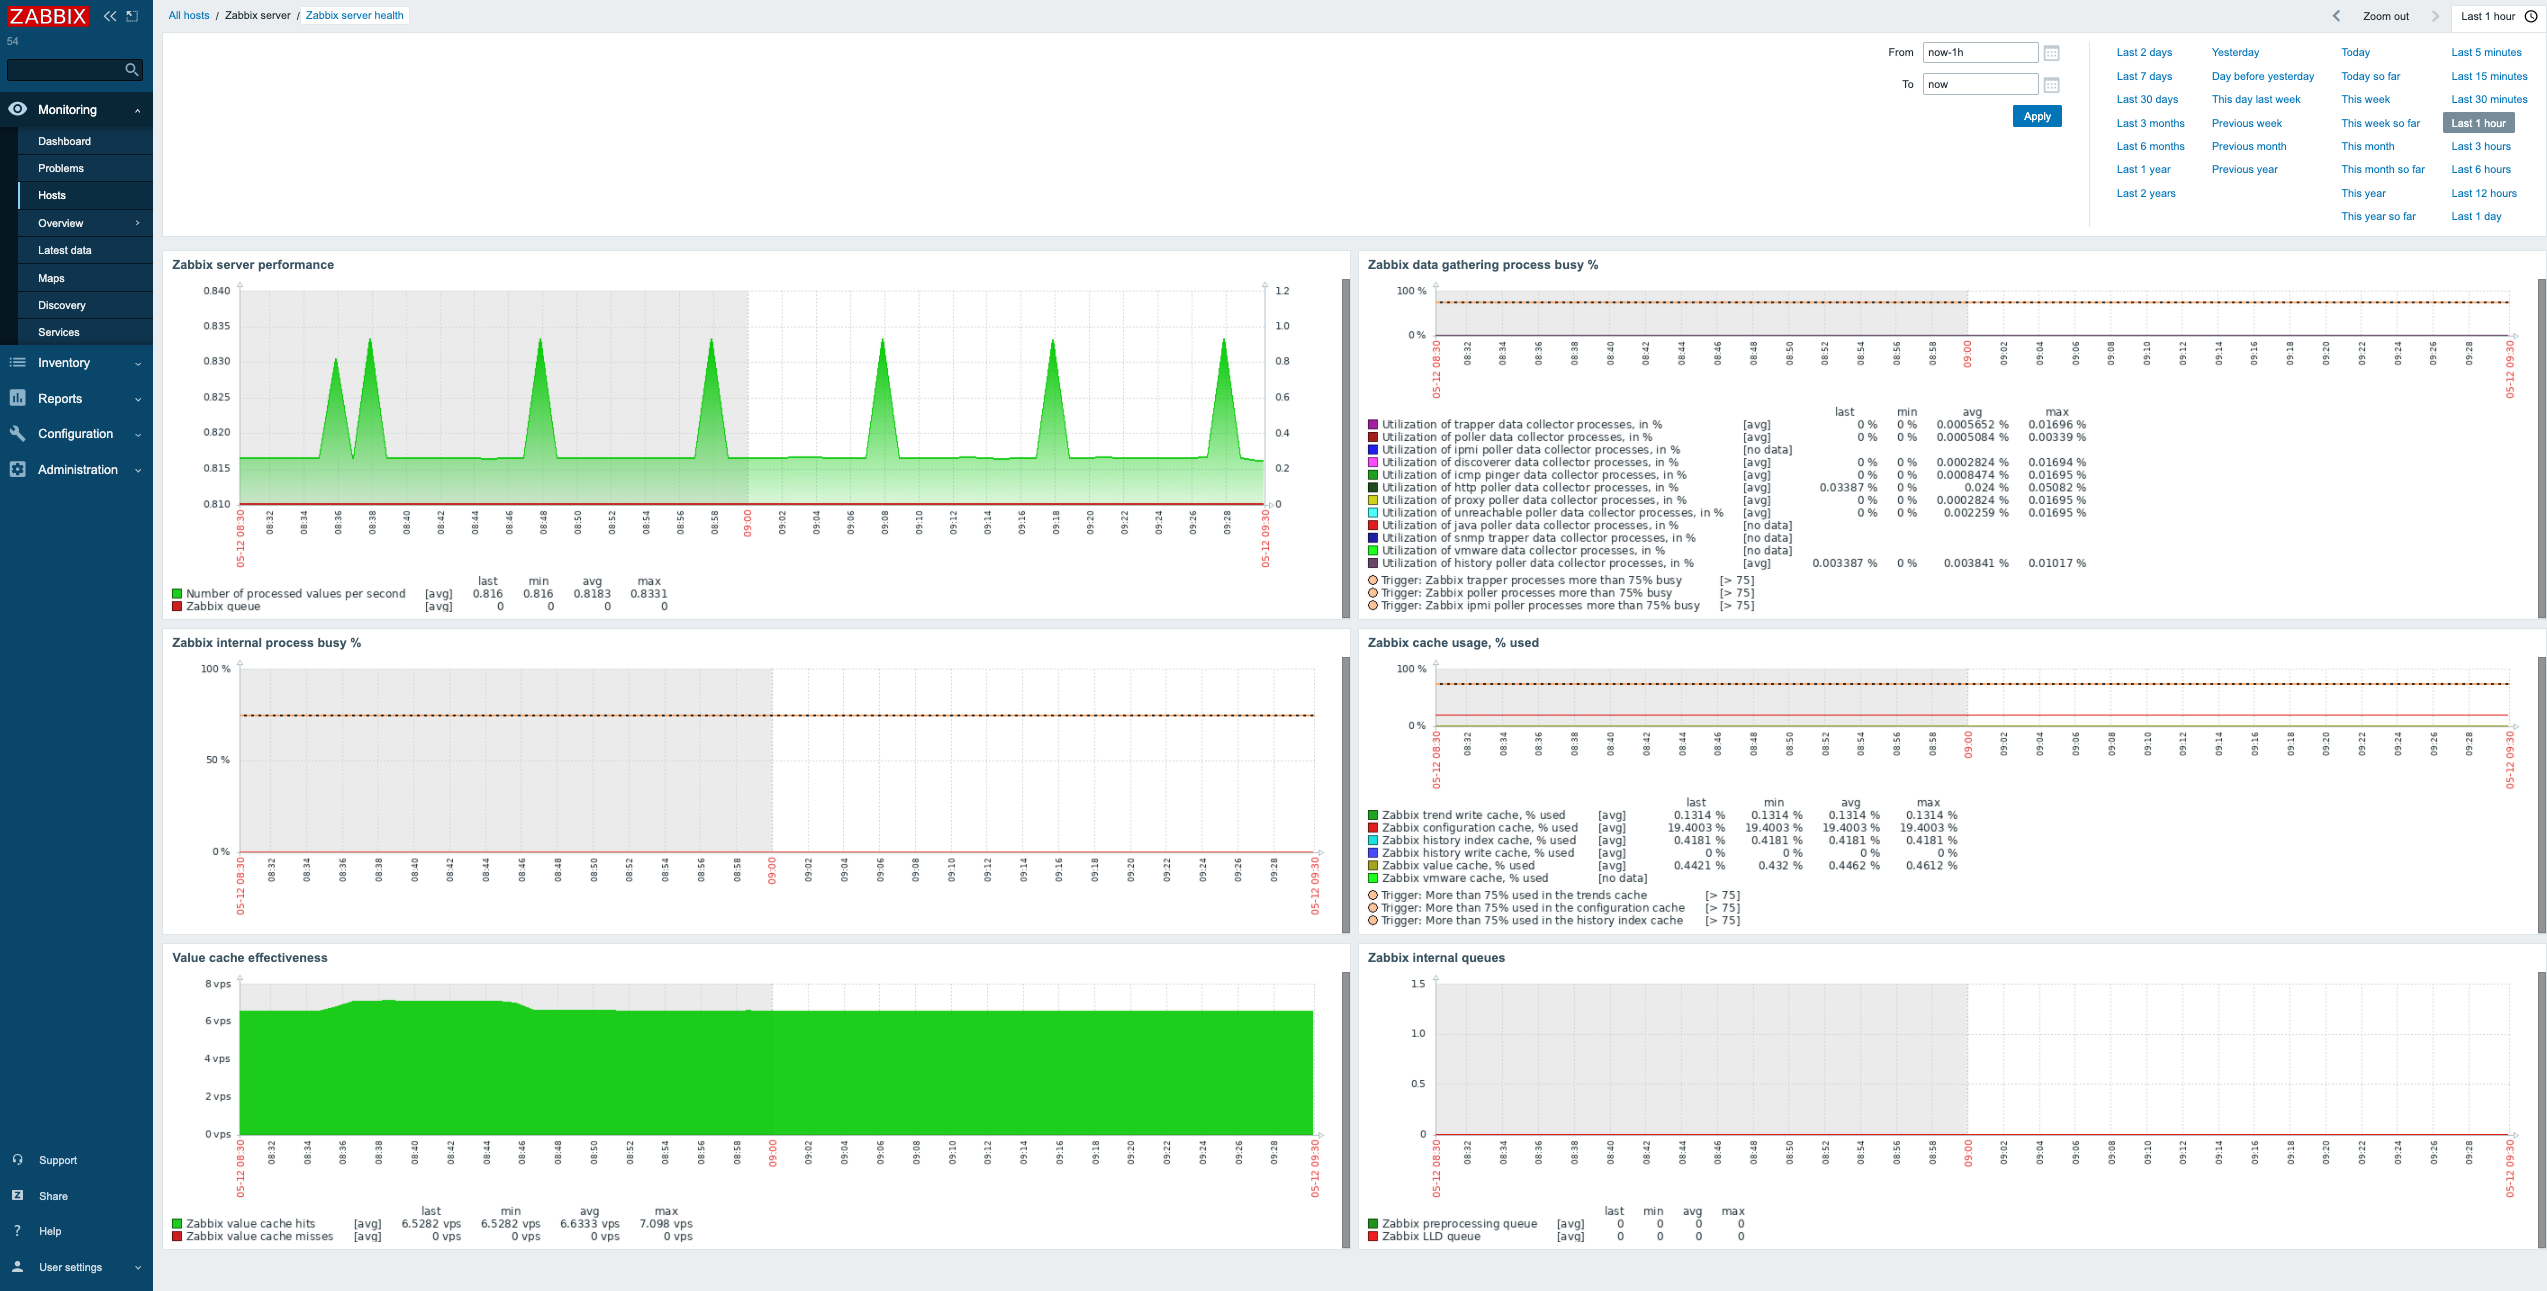
In browser 2: Go to Monitoring -> Hosts -> Find Zabbix server host, and open templated dashboards. Go to dashboard "Zabbix Server health" and see the differences.
Templated dashboard is extremely old, outdated and inconsistent. I think this template should be updated to match the global dashboard?