-
Type:
Problem report
-
Resolution: Fixed
-
Priority:
Trivial
-
Affects Version/s: 5.0.11, 5.4.0
-
Component/s: Frontend (F), Installation (I)
-
None
-
Sprint 76 (May 2021), Sprint 77 (Jun 2021)
-
0.125
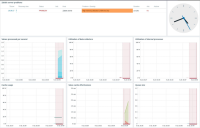
Default Zabbix server health dashboards contain graphs that can be very confusing, as they display any problems happening on Zabbix server hosts.
Example of new installation:
I think it would be better if graphs used the option to only display problems for the items displayed in this graph. Especially if we look at actual internal problems historically.
