-
Type:
Problem report
-
Resolution: Won't fix
-
Priority:
Critical
-
None
-
Affects Version/s: 5.0.12
-
Component/s: Agent (G)
-
None
-
Sprint 77 (Jun 2021), Sprint 78 (Jul 2021), Sprint 79 (Aug 2021), Sprint 80 (Sep 2021), Sprint 81 (Oct 2021), Sprint 82 (Nov 2021), Sprint 83 (Dec 2021), Sprint 84 (Jan 2022), Sprint 85 (Feb 2022), Sprint 86 (Mar 2022), Sprint 87 (Apr 2022), Sprint 88 (May 2022), Sprint 89 (Jun 2022), Sprint 90 (Jul 2022), Sprint 91 (Aug 2022), Sprint 92 (Sep 2022), Sprint 93 (Oct 2022), Sprint 94 (Nov 2022), Sprint 95 (Dec 2022), Sprint 96 (Jan 2023), Sprint 97 (Feb 2023), Sprint 98 (Mar 2023), Sprint 99 (Apr 2023), Sprint 100 (May 2023), Sprint 101 (Jun 2023), Sprint 102 (Jul 2023), Sprint 103 (Aug 2023), Sprint 104 (Sep 2023), Sprint 105 (Oct 2023), Sprint 106 (Nov 2023), Sprint 107 (Dec 2023), Sprint candidates, S2401
-
2
We have an Item in a template for AIX servers using key, "system.stat[cpu,pc]". This seems to work correctly on AIX "Shared CPU" servers, but incorrectly on AIX "Dedicated CPU" servers.
First, a Shared CPU server - here is some CPU usage output from vmstat:
$ vmstat 10 12
System configuration: lcpu=24 mem=58880MB ent=3.00
kthr    memory              page              faults              cpu
----- ----------- ------------------------ ------------ -----------------------
 r  b   avm   fre  re  pi  po  fr   sr  cy  in   sy  cs us sy id wa    pc    ec
 1  0 2894246 6479413   0   0   0   0    0   0  59 49866 748  6  1 93  0  0.68  22.8
 1  0 2894266 6479393   0   0   0   0    0   0  67 52235 827  6  2 92  0  0.71  23.5
...
In this case, the "pc" column is very close to the data that the Zabbix agent gathers, as would be expected.
Here is some example output from a Dedicated CPU server:
$ vmstat 10 30
System configuration: lcpu=16 mem=29696MB
kthr    memory              page              faults        cpu
----- ----------- ------------------------ ------------ -----------
 r  b   avm   fre  re  pi  po  fr   sr  cy  in   sy  cs us sy id wa
 1  0 1481398 3566625   0   0   0   0    0   0  27 6066 444  1  0 99  0
 1  0 1482258 3565764   0   0   0   0    0   0  40 6447 456  1  1 98  0
...
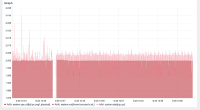
In this case, there is no "pc" column, but the "id" column indicates that the CPU usage is almost 100% idle. However, the Zabbix agent item returns values that are mostly around 4.0, although some are as high as 10. There are 4 physical CPUs dedicated to this server, so it almost seems like it is capture the CPU idle value, although that wouldn't explain the values as high as 10.
I'm attaching two files to this ticket, one from a Dedicated CPU server (aixXXXXX) and one from a Shared CPU server (urmXXXXX).
Each file contains output from the "lparstat -i" command which gives resource allocation allocation information. Each file also contains CPU usage via the "vmstat" command.
aixXXXXX.txt![]() urmXXXXX.txt
urmXXXXX.txt![]()
At the end, I've placed some data that the Zabbix agent is capturing during similar CPU usage, to compare to the output from vmstat.
The Zabbix server is v5.0.7 and the AIX agent is v5.0.8
Later we figured out that there is another key which is supporting additional options for AIX, so we changed key to
system.cpu.util[all,system,avg1,physical]
Even if the “system” parameter may not include everything (user,iowait,idle), the examples are showing values that are higher than the number of CPUs allocated to the LPAR, so that doesn’t seem correct.
Below is an example of an LPAR with a much higher CPU allocation and utilization. In this case, the values don’t go higher than the number of allocated virtual CPUs (80), but they don’t match the other monitoring software either (although, it could be a difference between “system” usage and “full” cpu usage).
The second monitoring tool is monitoring overall cpu usage in terms of the number of physical cpu’s consumed.


