-
Type:
Incident report
-
Resolution: Commercial support required
-
Priority:
 Trivial
-
None
-
Affects Version/s: None
-
Component/s: None
-
None
Steps to reproduce:
Physical machine host configuration
48 cpu、192G RAM、4T NVME DISK
Deploy the zabbix service using Docker with the following parameters
docker run --name zabbix-server-mysql -t \
      -e DB_SERVER_HOST="mysql-server" \
      -e MYSQL_DATABASE="zabbix" \
      -e MYSQL_USER="zabbix" \
      -e MYSQL_PASSWORD="zabbix_pwd" \
      -e MYSQL_ROOT_PASSWORD="root_pwd" \
      -e ZBX_JAVAGATEWAY="zabbix-java-gateway" \
      -e PHP_TZ="Asia/Taipei" \
      -e ZBX_STARTPOLLERS=10 \
      -e ZBX_STARTDISCOVERERS=10 \
      -e ZBX_STARTHTTPPOLLERS=10 \
      -e ZBX_CACHESIZE=10G \
      -e ZBX_STARTDBSYNCERS=10 \
      -e ZBX_VALUECACHESIZE=5G \
      -e ZBX_HISTORYCACHESIZE=1G \
      -e ZBX_HISTORYINDEXCACHESIZE=1G \
      -e ZBX_STARTPREPROCESSORS=10 \
      -e ZBX_STARTPOLLERSUNREACHABLE=10 \
      -e ZBX_TIMEOUT=1 \
      --network=zabbix-net \
      -p 10051:10051 \
      --restart unless-stopped \
      -d zabbix/zabbix-server-mysql:alpine-trunk
TiDB cluster is configured with 24 target host nodes
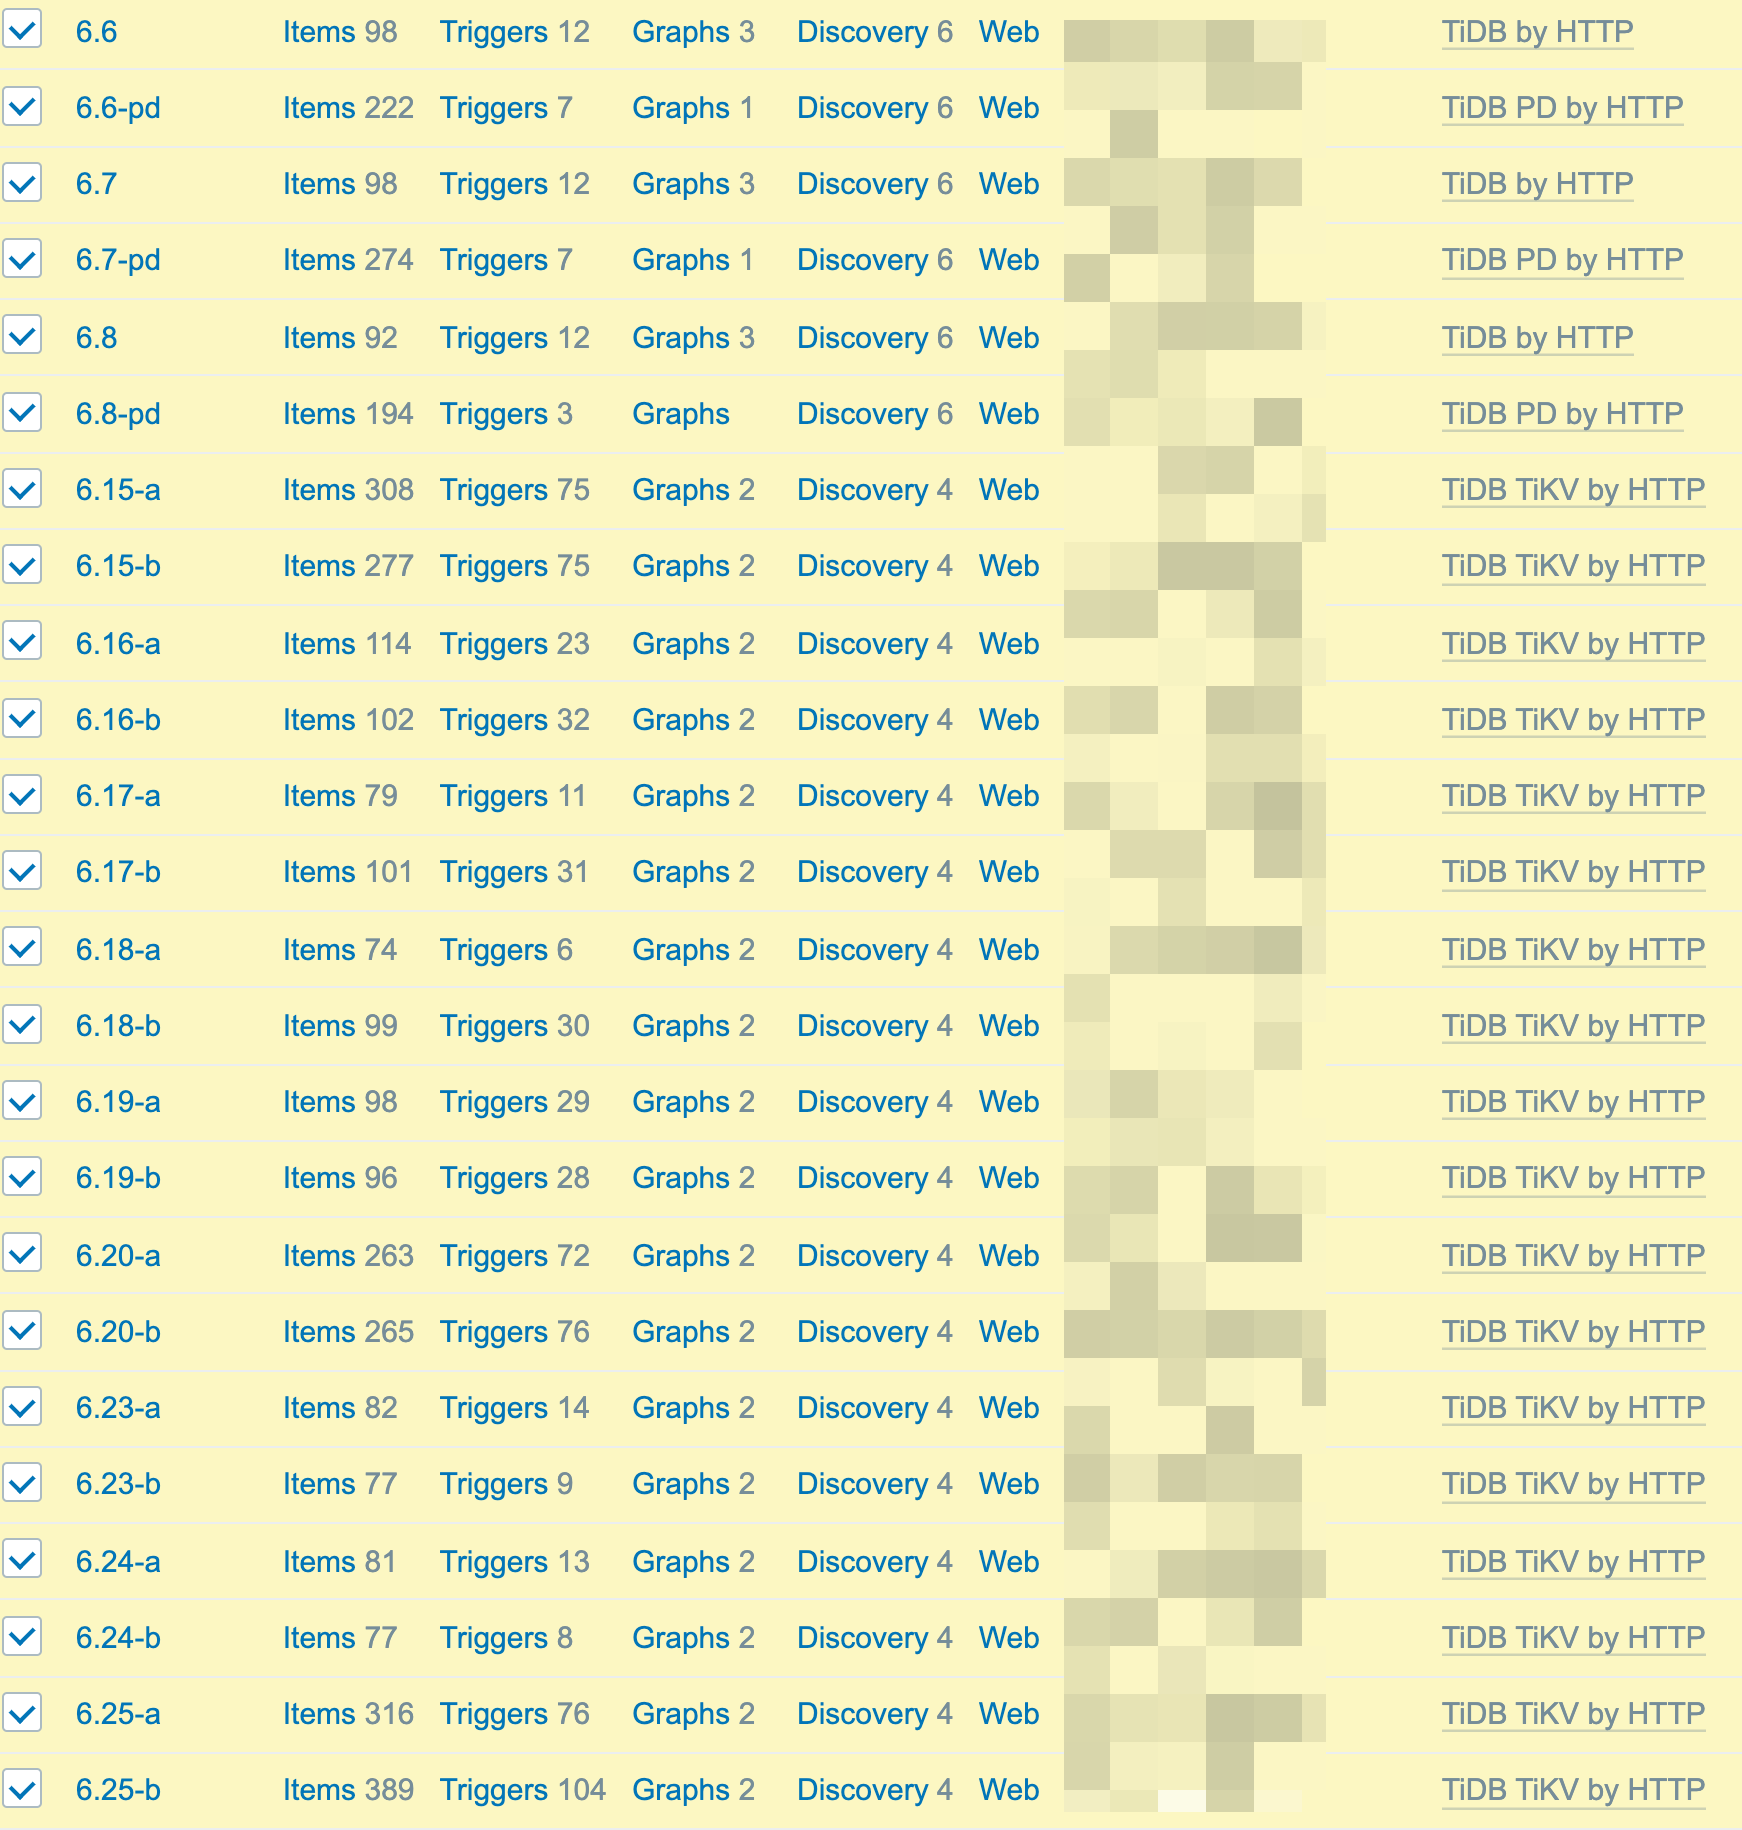

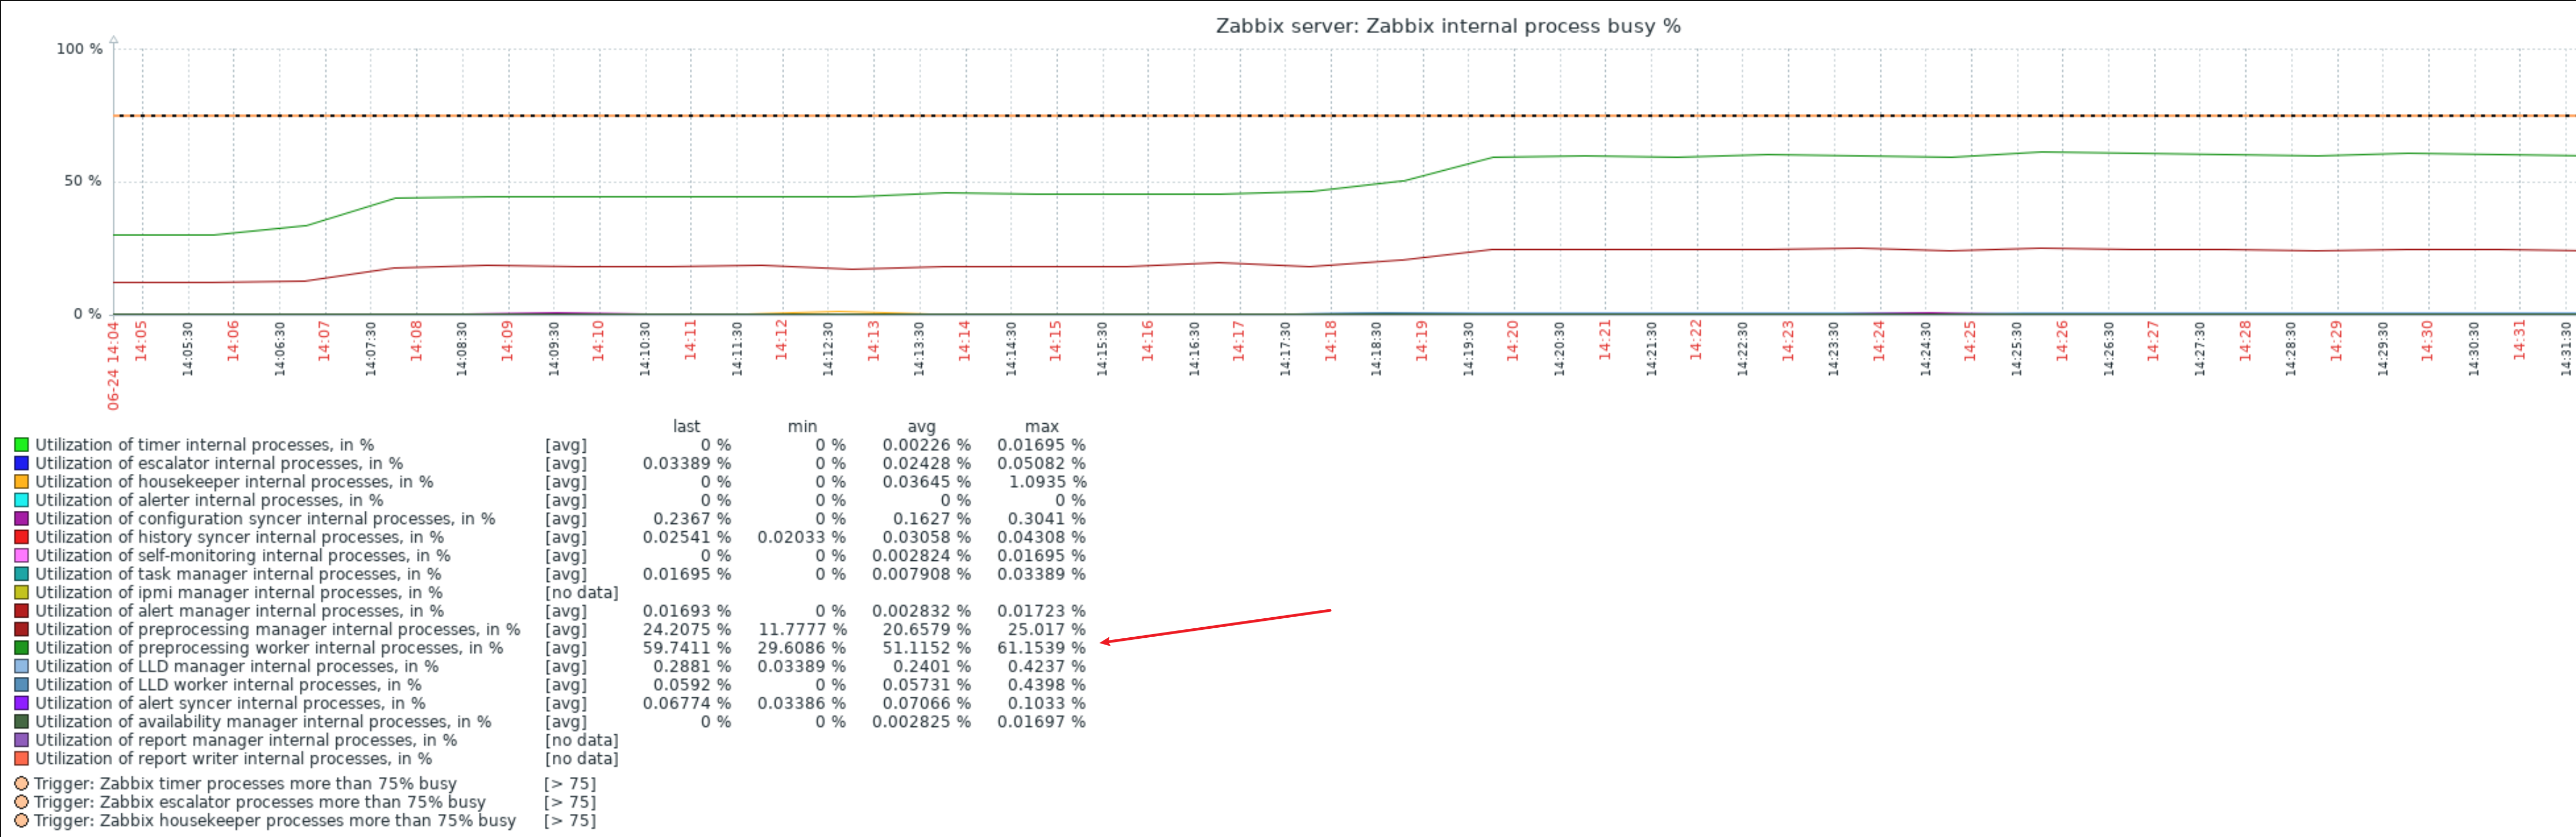
As the number of monitoring nodes increases, zabbix server will show "Zabbix preprocessing worker processes more than 75% busy" alarm and the target node (TiDB cluster node) monitoring data is delayed.
How can I optimize this? I am currently monitoring at least 100+ TiDB cluster nodes
Result:
See screenshot...
See log file...
See memory dump...
Expected:
See screenshot....
See attached patch file...