Uploaded image for project: 'ZABBIX BUGS AND ISSUES'
  1. ZABBIX BUGS AND ISSUES
  2. ZBX-19713

zabbix5.4.2 Scheduled report is generated but no graphical info shown on pdf attachment

XMLWordPrintable

    • Icon: Incident report Incident report
    • Resolution: Incomplete
    • Icon: Trivial Trivial
    • None
    • None
    • None
    • ubuntu server20.04LTS, nginx, mariadb10.5, zabbix 5.4.2

      Steps to reproduce:

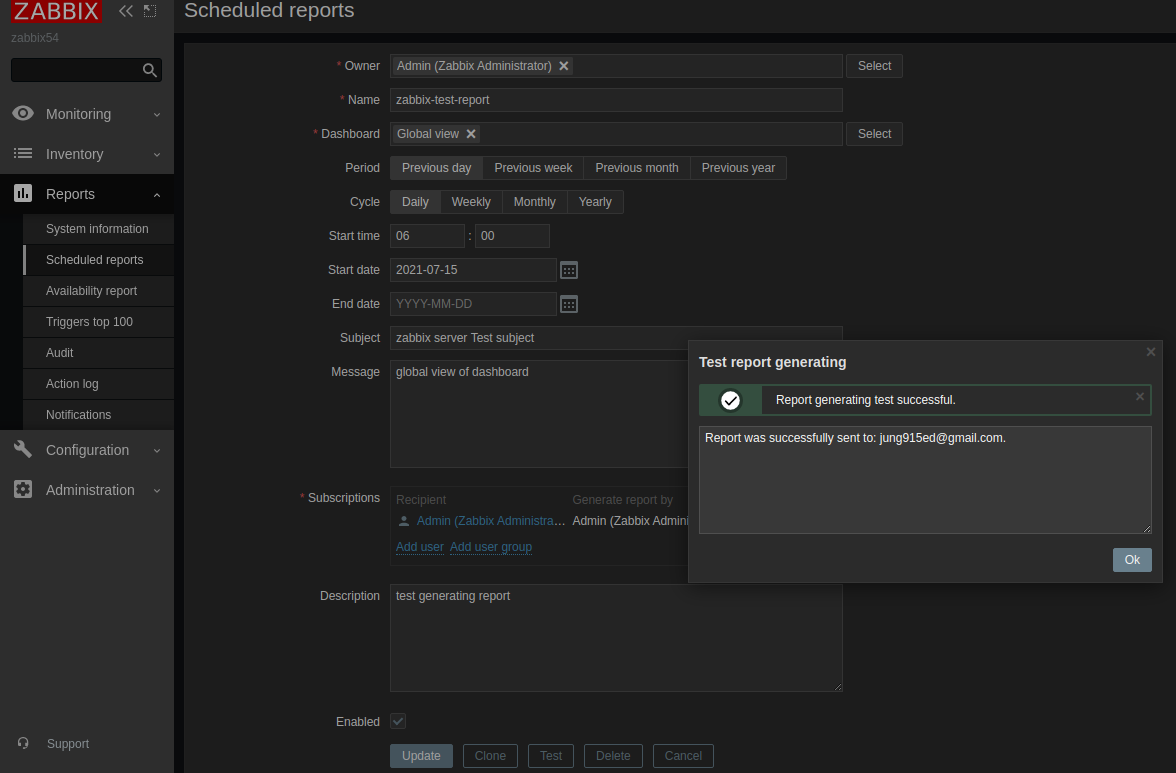
      1. setup scheduled report via email.
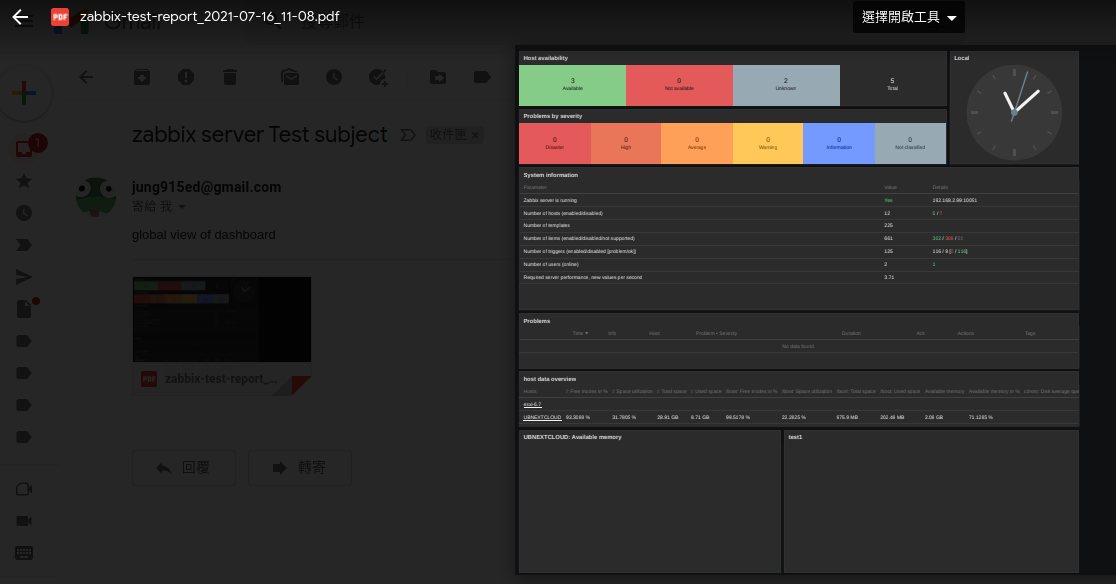
      2. pdf attachment generated with dashboard info.
      3. received attachment successfully.
      4. but graphical info is blank, only literal texts shown.
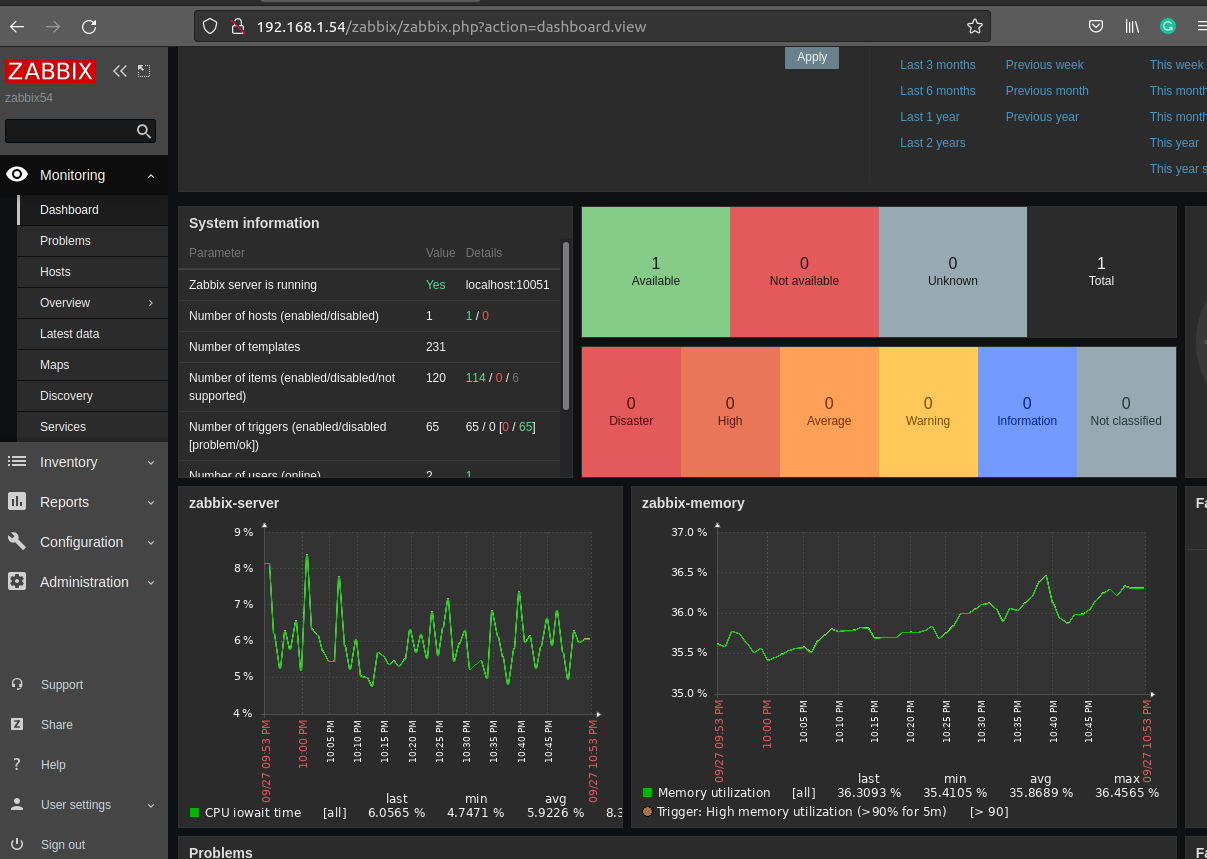
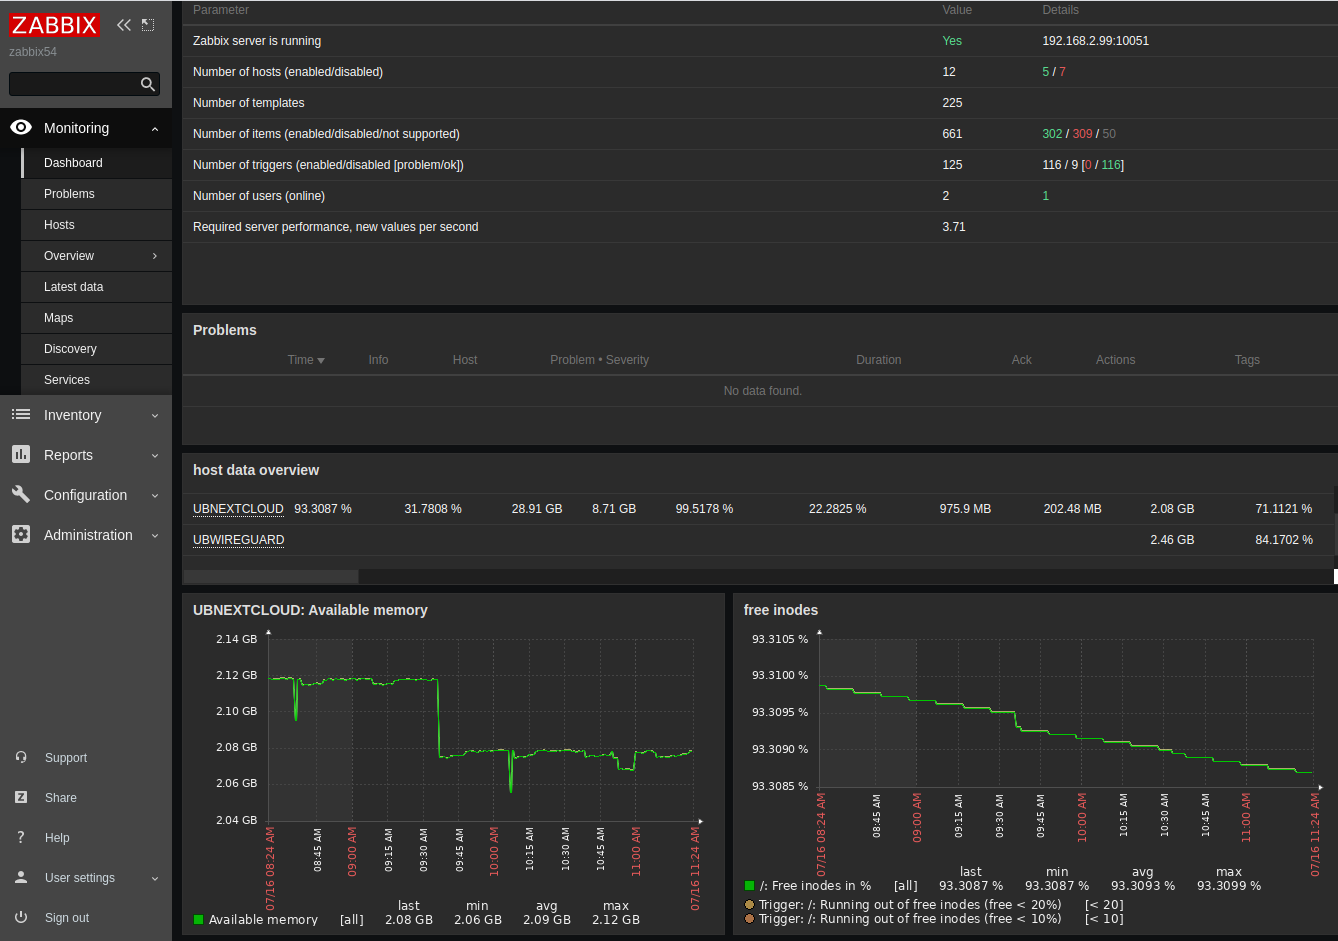
      5. dashboard works fine.

      please review my attachments with this issue
      See attached patch file.

        1. 2021-09-27_22-53.png
          132 kB
          edjung
        2. dashboard-monitor.png
          117 kB
          edjung
        3. email-received.png
          65 kB
          edjung
        4. generate-report-success.png
          84 kB
          edjung
        5. Test_report_2021-10-11_08-01-ubuntu.pdf
          75 kB
          Antons Sincovs
        6. test_report_zabbix-server-cpu-interrup-time-graph.pdf
          76 kB
          Antons Sincovs
        7. test-report_2021-08-03_14-43.pdf
          54 kB
          edjung
        8. test-report_2021-09-27_22-46.pdf
          56 kB
          edjung
        9. test-report_2021-10-23_21-07.pdf
          65 kB
          edjung
        10. web-service-err.png
          115 kB
          edjung
        11. zabbix-test-report_2021-07-16_11-08.pdf
          39 kB
          edjung
        12. zabbix-test-report_2021-07-20_22-57.pdf
          10 kB
          edjung
        13. zabbix-web-service.log.txt
          2 kB
          edjung

            zabbix.support Zabbix Support Team
            edjung edjung
            Votes:
            0 Vote for this issue
            Watchers:
            4 Start watching this issue

              Created:
              Updated:
              Resolved: