-
Type:
Incident report
-
Resolution: Unresolved
-
Priority:
 Minor
Minor
-
None
-
Affects Version/s: 5.4.3
-
Component/s: Frontend (F)
-
None
Steps to reproduce:
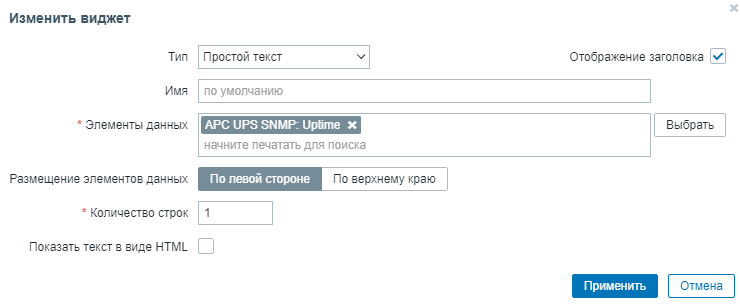
- Create dashboard in any template assigned to host
- Add widget with simple text and select one item, which have long history
- Save dashboard and open it for view.
Result:
- Slow loading of widgets
- Massive consumption of memory and CPU by PostgreSQL
Example of failing query:
SQL (3.824089): SELECT MAX(h.clock) FROM history_uint h WHERE h.itemid='871275'
zabbix.php:22 → require_once() → ZBase->run() → ZBase->processRequest() → CController->run() → CControllerWidgetPlainTextView->doAction() → CHistoryManager->getLastValues() → CHistoryManager->getLastValuesFromSql() → DBselect() in include/classes/api/managers/CHistoryManager.php:215
After quick and dirty hack
--- app/controllers/CControllerWidgetPlainTextView.php.orig     2021-08-09 16:46:10.322546019 +0700
+++ app/controllers/CControllerWidgetPlainTextView.php  2021-08-09 16:46:24.160616626 +0700
@@ -91,7 +91,7 @@
                                // macros
                                $items = CMacrosResolverHelper::resolveItemNames($items);

-                               $histories = Manager::History()->getLastValues($items, $fields['show_lines']);
+                               $histories = Manager::History()->getLastValues($items, $fields['show_lines'], 86400);

                                if ($histories) {
                                        $histories = call_user_func_array('array_merge', $histories);
the page loads much faster and resource consumption is normal.
SQL query is:
SQL (0.001613): SELECT MAX(h.clock) FROM history_uint h WHERE h.itemid='870891' AND h.clock>1628413643
zabbix.php:22 → require_once() → ZBase->run() → ZBase->processRequest() → CController->run() → CControllerWidgetPlainTextView->doAction() → CHistoryManager->getLastValues() → CHistoryManager->getLastValuesFromSql() → DBselect() in include/classes/api/managers/CHistoryManager.php:215
The problem is possible similar to Latest data recent problems.