-
Type:
Problem report
-
Resolution: Workaround proposed
-
Priority:
Trivial
-
None
-
Affects Version/s: 5.4.2, 5.4.3
-
Component/s: Templates (T)
I have an instance with large number of DB (over 20).
Zabbix MSSQL tamplate can't monitor it because the JSON of "MSSQL: Get performance counters" return over 65555 char and is truncated. Error on screen: Template out of index => 0 symbol remain.
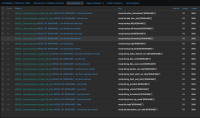
The first part of query in this template return a large amount of rows (over 2600, screen: MSSQL query number of row)
For temp fix i have cloned this template on 3 template:
Template: MSSQL: Get performance counters General
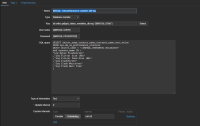
I have change the inital query (SELECT object_name,counter_name,instance_name,cntr_value FROM sys.dm_os_performance_counters) with query of only used values (screen: Query Template general)
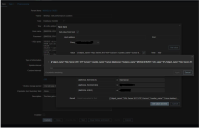
Mass update for all item on MSSQL Templace with this new template (screen: Use of general template)
Template MSSQL: Get performance counters DB-state and MSSQL: Get performance counters DB-log
I have use this template for monitoring the single DBs on MSSQL by ODBC: Database discovery
I have split this monitor into 2 template because, with istance over 50 DB and only 1 template, i have another out of bound.
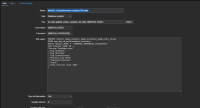
Screen of 2 query template (Template DB-log and Template DB-state) and use on Database discovery Item (Use of db template)
My fix does not work as DBs grow.
A different method is provided to monitor this type of instances or the official template is limited in the number of databases present?


