-
Type:
Problem report
-
Resolution: Unresolved
-
Priority:
 Trivial
-
None
-
Affects Version/s: 5.4.8, 6.0.0beta3
-
Component/s: None
-
None
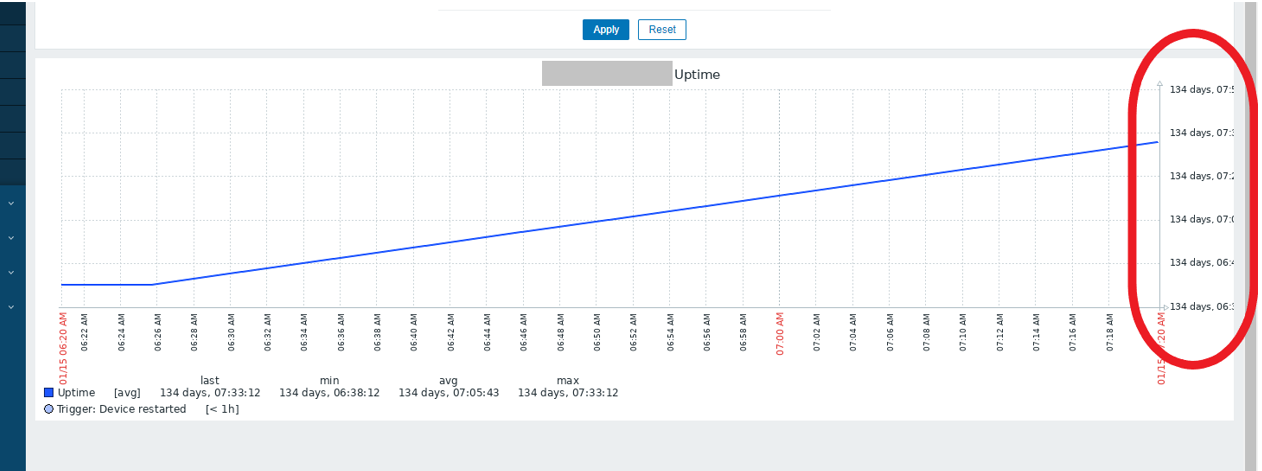
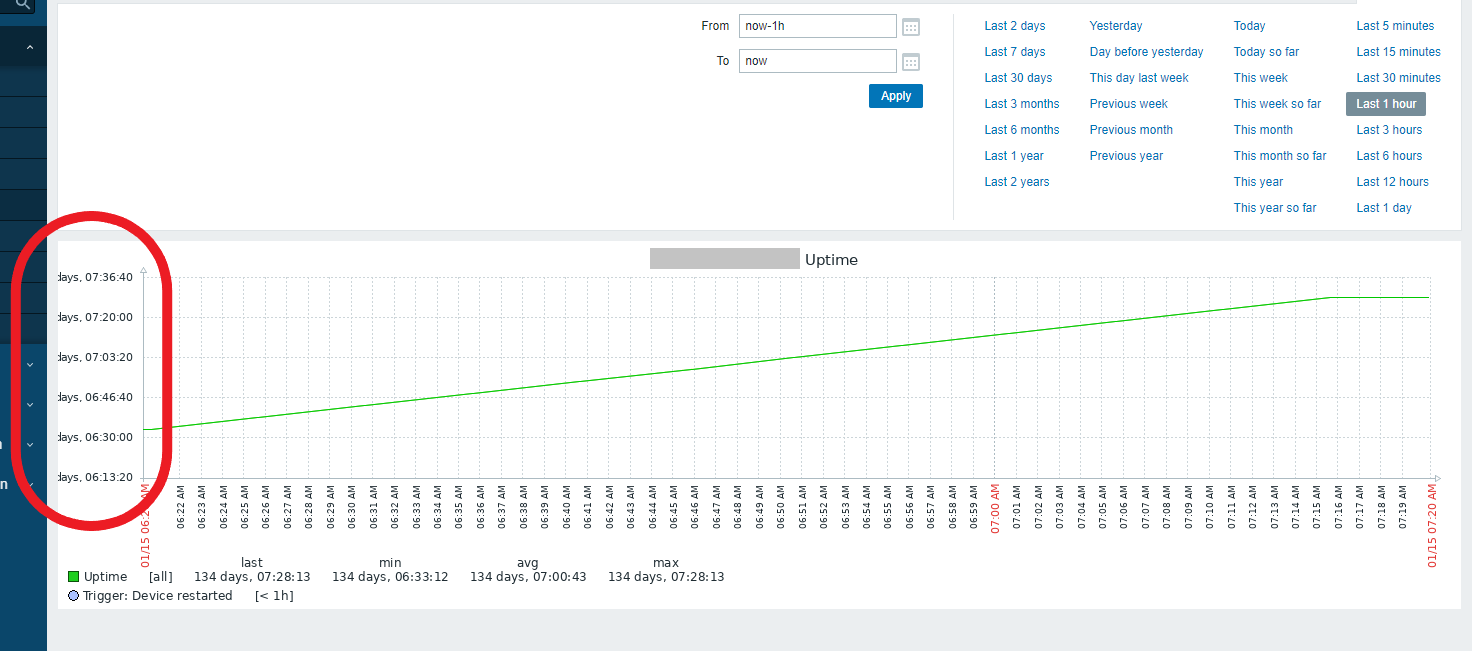
On graphs, when Y axis value is long, the text is cut off from the graph.
Graph below represents uptime for a given host. It's a simple graph generated from latest data. Since Y axis value is long, it's being cut off from the graph. Graph legend shows 134 days, but this information is being cut off from the Y axis value.

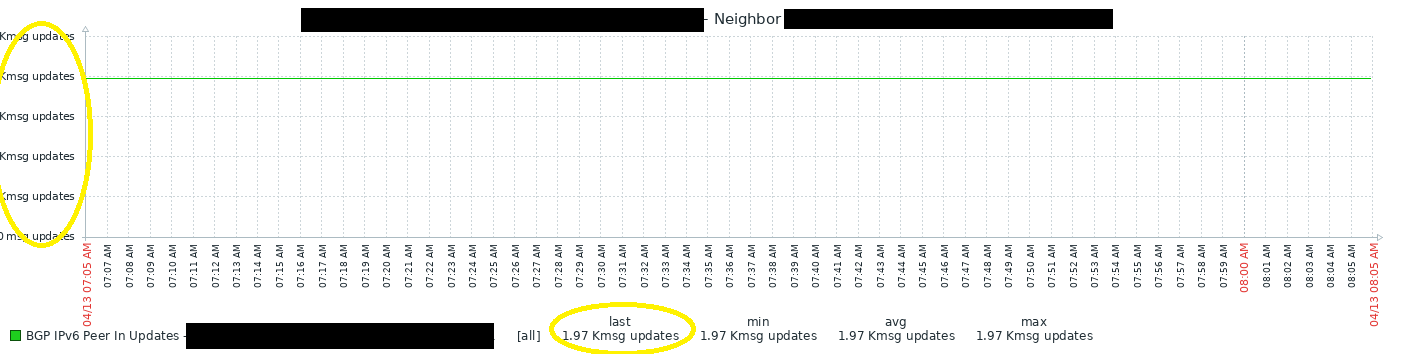
The same applies when a graph is generated by Graphs mode. Even when the Y axis is on the right side, the value is still being cut off.