-
Type:
Problem report
-
Resolution: Duplicate
-
Priority:
Major
-
None
-
Affects Version/s: 6.0.2
-
Component/s: Frontend (F)
-
Environment:Rocky Linux/CentOS 8
Steps to reproduce:
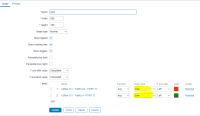
- Create a graph of items being monitored on a host.
- Change the "Draw Style" to anything other than "Line"
- Press the Add button to add the graph.
- Go back in and edit the graph and the "Draw Style" will be line.
- The graph items are always line and display as line when viewing graphs.
- If you select the preview tab, it previews correctly, but always saves as line.
Result:
See attached screenshot...
- duplicates
-
ZBX-20752 saved properties of classic graphs in v6.0 are lost when open graph again
-
- Closed
-
