-
Type:
Problem report
-
Resolution: Unresolved
-
Priority:
Trivial
-
None
-
Affects Version/s: 6.2.0rc1
-
Component/s: Frontend (F)
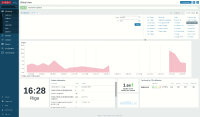
If "Treat as 0" approach is selected in Missing data field of graph widget configuration, then the way that some part of missing data is displayed is dependent on the displayed time period. For a certain time period some missing data is displayed as 0 and for longer time periods - as connected points before and after the missing data time period:

Graph widget should not change the displayed values at same points in time based on the length of the displayed time period.
Steps to reproduce:
- Create a graph widget with a single data set
- Collect data for tome period of time (some 10 min)
- Stop server for approximately 4 min
- Start server to a minute or two
- Stop server for some 8-10 min
- Start server to resume collecting data
- Open the dashboard with the graph widget
- Check the way the periods with missing data are displayed for different time periods.
Result:
For some displayed time periods the time short (4 min) periods with missing data are displayed correctly (as zero), but for some - as connected values before and after the period (see above gif).
Expected:
The displayed values should not differ based on the time period displayed in the graph widget. In our case, both periods should be treated as 0 value.