-
Type:
Problem report
-
Resolution: Unresolved
-
Priority:
 Trivial
-
None
-
Affects Version/s: None
-
Component/s: None
-
None
-
Environment:Zabbix 6.0.5
PSQL 13
Apache
Attaches screenshots to present the issue.
Steps to reproduce:
- Upgrade zabbix 5.4 to 6 ( Was working fine since Zabbix 4.4)
Result:
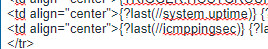
Mails defined as alert actions have configured item last values in tables. System uptime and ICMP response time.
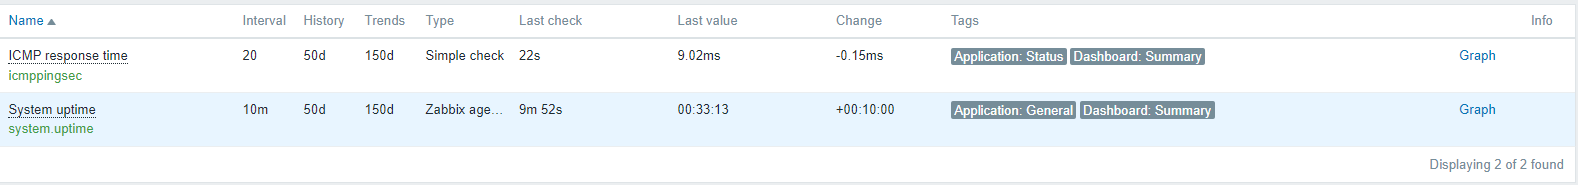
Values in mail table are presented in RAW format - non human readable like it is presented in Latest data site.
icmp response time is presented with many places after dot instead simple "9 ms"
uptime is presented in seconds instead conversion to human readable format 00:01:00
Expected:
Expexting to see values in mail the same way it is presented in "latest data" table.


- is duplicated by
-
-
- Closed
-