-
Type:
Incident report
-
Resolution: Duplicate
-
Priority:
 Trivial
-
None
-
Affects Version/s: 6.0.5
-
Component/s: Frontend (F)
-
Environment:Zabbix Frontend => zabbix/zabbix-web-nginx-pgsql:6.0-ubuntu-latest
Steps to reproduce:
- Open Dashboard that includes a classic Graph
- Dashboard opens, shows all Widgeds, Graph not shown or shown after a long time
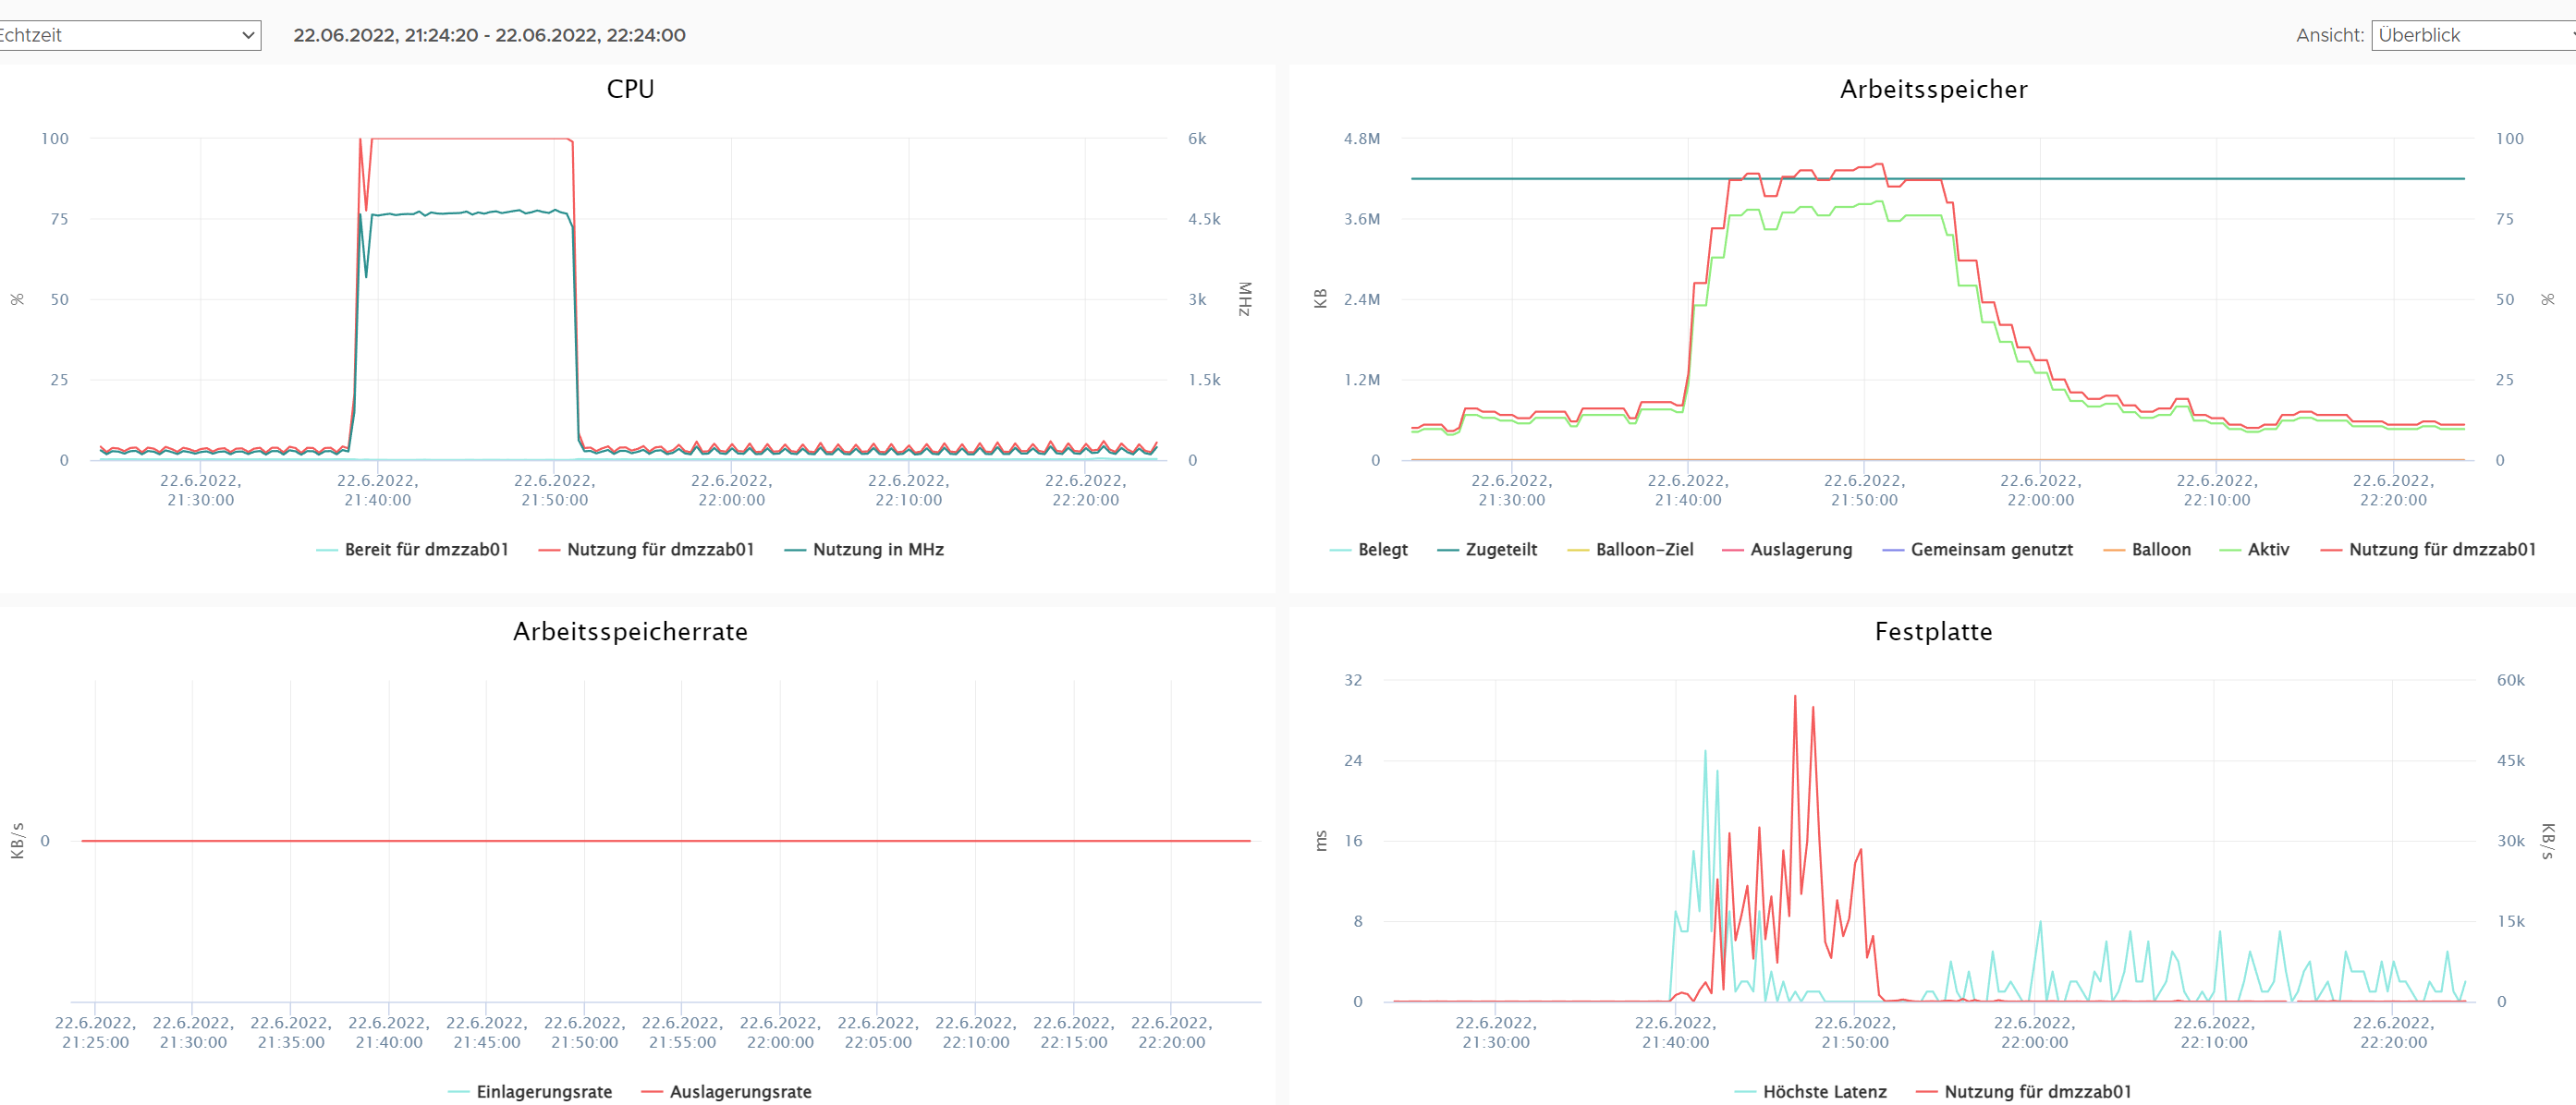
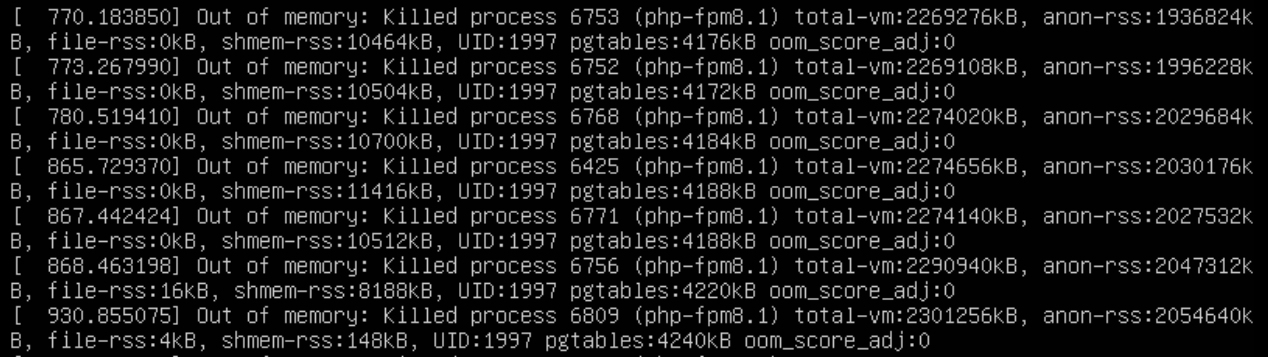
Result:
top shows a lot of php-fpm8.1 processes with 100% CPU
System-Load increases fast (some times >50)
Test:
extend to 16 CPU Cores/16GB Ram, 2 Users, 2 Dashboard, 5 Graphs
Result:
16 CPU Cores at 100% >15min, system load ~20, some processes with 2G RAM reserved
Workaround:
using zabbix/zabbix-web-nginx-pgsql:6.0-alpine-latest
graph is displayed immediately, no CPU load
i suspect that it might be related to the php version. Ubuntu uses PHP8.1, Alpine PHP8
- duplicates
-
ZBX-21302 Graph takes long time to load content after server upgrade to version 6.0.5
-
- Closed
-