-
Type:
Incident report
-
Resolution: Unresolved
-
Priority:
 Trivial
-
None
-
Affects Version/s: 5.0.26
-
Component/s: None
-
None
-
Environment:Linux, zabbix 6.0
In ZBXNEXT-5250 "screens" functionality was removed. Unfortunately, I'm unable to replicate similar experience with Dashboards yet there is a valid use case where we needed exactly screens: after we changed anything in our network infrastructure we need to skim through all graphs (more then 150 ports on commutator) with load/drops on our commutator. It was very easy with Screen: just open page and scroll.
The closest dashboard type I found is Graph prototype. With that I'm unable to achieve similar experience:
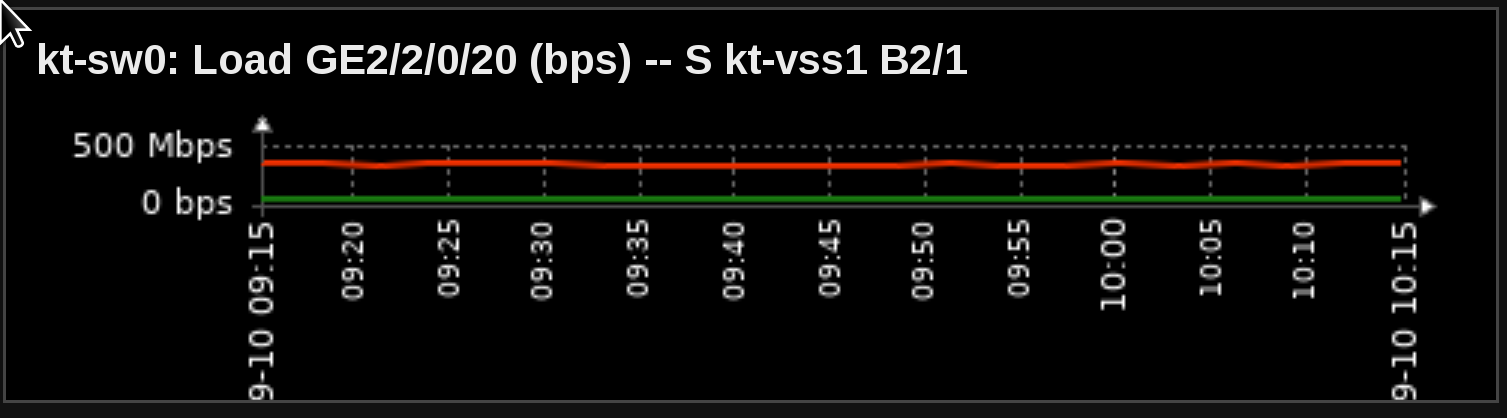
1. Height of graphs is very tiny and I failed to find how to change that. Even the date is not visible and the graphics themselves are practically straight lines:
I don't understand what can I notice anything on such a graph... Is there any way to make graphs of normal height?
2. Widget allows only to have 16 rows of graphics. It's not enough. After changes on the network, I need to scroll more then 150 ports to look for anomalies and it's very inconvenient to switch pages for that since you have to scroll down, then up to change page, wait for load, and repeat. Currently, I have 11 pages to switch and that's crazy. My browser perfectly loaded screens with lot's of graphics, so I don't understand why do we have a such limit?
Screens were optimal. Is it possible to return them back or fix Dashboards? Or... may be I miss something evident?