-
Type:
Problem report
-
Resolution: Unresolved
-
Priority:
 Trivial
-
None
-
Affects Version/s: 6.0.9, 6.2.2, 6.2.3
-
Component/s: Agent (G)
-
None
-
Environment:Zabbix Agent2 (v6.0.x, v6.2.x) on Linux (Debian) and Windows
Zabbix Server: 6.2.3
Zabbix Proxy: 6.2.3
Description
In our queues we’ve noticed regular Zabbix Agent 2 being ‘stuck’ or taking too much time for basic items. Through our centralized logging we’ve found out that on all our 20 proxies that they are all behaving in the same exact way.
Our proxy logs are containing the following errors:
Zabbix agent item "perf_counter_en["\Memory\Cache Bytes"]" on host "A" failed: first network error, wait for 45 seconds
Zabbix agent item "system.cpu.util[,user]" on host "B" failed: first network error, wait for 45 seconds
Zabbix agent item "system.uptime" on host "C" failed: first network error, wait for 45 seconds
Zabbix agent item "perf_counter_en["\PhysicalDisk(2 E:)\% Disk Time",60]" on host "D" failed: first network error, wait for 45 seconds
In our complete infrastructure we’re seeing this kind of log line 150 000 times over a period of 48 hours. It looks quite severe that agents are being marked as unreachable for a period of time, resulting in data being pushed too late and/or data points are not collected as we’re expecting.
containing the exact same error. For this case we’ll be focusing on a host we refer to as ‘web012.ctr’.
Let’s focus on where we’ve spotted the issue, the Zabbix Proxy logs, we’re seeing:
Sep-30     2022 @ 13:23:53.159  | proxy001 | Zabbix agent item "agent.ping" on host "web012.ctr" failed: first network error, wait for 45 seconds
Sep-30     2022 @ 13:24:38.030  | proxy001 | resuming Zabbix agent checks on host "web012.ctr": connection restored
At the same time in the Zabbix Agent 2 logs we’re noticing this kind of behavior:
2022/09/30 13:23:53.133253 sending passive check response: '1.103264' to '172.29.63.48'
2022/09/30 13:23:54.001301 plugin VFSDev: executing collector task
2022/09/30 13:23:54.001361 plugin Cpu: executing collector task
2022/09/30 13:23:55.000957 plugin Cpu: executing collector task
2022/09/30 13:23:55.001051 plugin VFSDev: executing collector task
2022/09/30 13:23:56.000710 plugin Cpu: executing collector task
2022/09/30 13:23:56.000751 plugin VFSDev: executing collector task
2022/09/30 13:23:57.001005 plugin Cpu: executing collector task
2022/09/30 13:23:57.001178 plugin VFSDev: executing collector task
2022/09/30 13:23:58.000827 plugin Cpu: executing collector task
2022/09/30 13:23:58.000870 plugin VFSDev: executing collector task
2022/09/30 13:23:59.000445 plugin Cpu: executing collector task
2022/09/30 13:23:59.000499 plugin VFSDev: executing collector task
2022/09/30 13:24:00.000967 plugin Cpu: executing collector task
2022/09/30 13:24:00.001038 plugin VFSDev: executing collector task
2022/09/30 13:24:01.001068 plugin Cpu: executing collector task
2022/09/30 13:24:01.001106 plugin VFSDev: executing collector task
2022/09/30 13:24:02.000587 plugin Cpu: executing collector task
2022/09/30 13:24:02.000623 plugin VFSDev: executing collector task
2022/09/30 13:24:03.000666 plugin VFSDev: executing collector task
2022/09/30 13:24:03.000716 plugin Cpu: executing collector task
2022/09/30 13:24:04.000261 plugin Cpu: executing collector task
2022/09/30 13:24:04.000303 plugin VFSDev: executing collector task
2022/09/30 13:24:05.000771 plugin Cpu: executing collector task
2022/09/30 13:24:05.000812 plugin VFSDev: executing collector task
2022/09/30 13:24:06.000598 plugin Cpu: executing collector task
2022/09/30 13:24:06.000685 plugin VFSDev: executing collector task
2022/09/30 13:24:07.001228 plugin Cpu: executing collector task
2022/09/30 13:24:07.001270 plugin VFSDev: executing collector task
2022/09/30 13:24:08.001232 plugin VFSDev: executing collector task
2022/09/30 13:24:08.001297 plugin Cpu: executing collector task
2022/09/30 13:24:09.000968 plugin Cpu: executing collector task
2022/09/30 13:24:09.001038 plugin VFSDev: executing collector task
2022/09/30 13:24:10.000774 plugin Cpu: executing collector task
2022/09/30 13:24:10.000812 plugin VFSDev: executing collector task
2022/09/30 13:24:11.000514 plugin Cpu: executing collector task
2022/09/30 13:24:11.000574 plugin VFSDev: executing collector task
2022/09/30 13:24:12.001208 plugin Cpu: executing collector task
2022/09/30 13:24:12.001316 plugin VFSDev: executing collector task
2022/09/30 13:24:13.000881 plugin Cpu: executing collector task
2022/09/30 13:24:13.000927 plugin VFSDev: executing collector task
2022/09/30 13:24:14.000942 plugin VFSDev: executing collector task
2022/09/30 13:24:14.000985 plugin Cpu: executing collector task
2022/09/30 13:24:15.000575 plugin Cpu: executing collector task
2022/09/30 13:24:15.000625 plugin VFSDev: executing collector task
2022/09/30 13:24:16.001249 plugin Cpu: executing collector task
2022/09/30 13:24:16.001300 plugin VFSDev: executing collector task
2022/09/30 13:24:17.001183 plugin Cpu: executing collector task
2022/09/30 13:24:17.001218 plugin VFSDev: executing collector task
2022/09/30 13:24:18.000855 plugin Cpu: executing collector task
2022/09/30 13:24:18.000947 plugin VFSDev: executing collector task
2022/09/30 13:24:19.001913 plugin VFSDev: executing collector task
2022/09/30 13:24:19.001984 plugin Cpu: executing collector task
2022/09/30 13:24:20.000563 plugin Cpu: executing collector task
2022/09/30 13:24:20.000609 plugin VFSDev: executing collector task
2022/09/30 13:24:21.000999 plugin Cpu: executing collector task
2022/09/30 13:24:21.001080 plugin VFSDev: executing collector task
2022/09/30 13:24:22.000667 plugin Cpu: executing collector task
2022/09/30 13:24:22.000705 plugin VFSDev: executing collector task
2022/09/30 13:24:23.001334 plugin Cpu: executing collector task
2022/09/30 13:24:23.001375 plugin VFSDev: executing collector task
2022/09/30 13:24:24.000793 plugin Cpu: executing collector task
2022/09/30 13:24:24.000843 plugin VFSDev: executing collector task
2022/09/30 13:24:25.000415 plugin Cpu: executing collector task
2022/09/30 13:24:25.000456 plugin VFSDev: executing collector task
2022/09/30 13:24:26.001071 plugin Cpu: executing collector task
2022/09/30 13:24:26.001136 plugin VFSDev: executing collector task
2022/09/30 13:24:27.000613 plugin Cpu: executing collector task
2022/09/30 13:24:27.000667 plugin VFSDev: executing collector task
2022/09/30 13:24:28.001065 plugin VFSDev: executing collector task
2022/09/30 13:24:28.001113 plugin Cpu: executing collector task
2022/09/30 13:24:29.000598 plugin Cpu: executing collector task
2022/09/30 13:24:29.000639 plugin VFSDev: executing collector task
2022/09/30 13:24:30.001597 plugin Cpu: executing collector task
2022/09/30 13:24:30.001637 plugin VFSDev: executing collector task
2022/09/30 13:24:31.001027 plugin Cpu: executing collector task
2022/09/30 13:24:31.001076 plugin VFSDev: executing collector task
2022/09/30 13:24:32.000936 plugin VFSDev: executing collector task
2022/09/30 13:24:32.000971 plugin Cpu: executing collector task
2022/09/30 13:24:32.983762 [101] In sendHeartbeatMsg() from [172.29.63.48:10051]
2022/09/30 13:24:32.983803 connecting to [172.29.63.48:10051] [timeout:30s, connection timeout:30s]
2022/09/30 13:24:32.986035 connection established using TLSv1.3 TLS_CHACHA20_POLY1305_SHA256
2022/09/30 13:24:32.986057 sending [{"request":"active check heartbeat","host":"web012.ctr","heartbeat_freq":60}] to [172.29.63.48:10051]
2022/09/30 13:24:32.987670 receiving data from [172.29.63.48:10051]
2022/09/30 13:24:32.989000 received [] from [172.29.63.48:10051]
2022/09/30 13:24:32.989240 [101] End of sendHeartBeatMsg() from [172.29.63.48:10051]
2022/09/30 13:24:33.000398 plugin Cpu: executing collector task
2022/09/30 13:24:33.000431 plugin VFSDev: executing collector task
2022/09/30 13:24:34.001057 plugin Cpu: executing collector task
2022/09/30 13:24:34.001117 plugin VFSDev: executing collector task
2022/09/30 13:24:35.000720 plugin Cpu: executing collector task
2022/09/30 13:24:35.000766 plugin VFSDev: executing collector task
2022/09/30 13:24:36.000281 plugin Cpu: executing collector task
2022/09/30 13:24:36.000321 plugin VFSDev: executing collector task
2022/09/30 13:24:37.000570 plugin Cpu: executing collector task
2022/09/30 13:24:37.000626 plugin VFSDev: executing collector task
2022/09/30 13:24:38.001350 plugin Cpu: executing collector task
2022/09/30 13:24:38.001382 plugin VFSDev: executing collector task
2022/09/30 13:24:38.003885 connection established using TLSv1.3 TLS_CHACHA20_POLY1305_SHA256
2022/09/30 13:24:38.004298 received passive check request: 'system.localtime' from '172.29.63.48'
I am seeing tons of collector tasks for Cpu and VFSDev being started at the same moment we’re actually seeing these ‘first network error, wait for 45 seconds’ errors on the proxy.
Normally they’re passing by 5 or 10 times max, without any issues. However when they’re passing by in these kind of numbers (see the snippet above) we're seeing the issue every time on the proxy.
On all timestamps attached in the CSV we’re seeing this kind of behavior, the agent reconnects again immediately after the last ‘executing collector task’.
All our hosts are using TLS PSK encryption out of the box. We’ve also disabled this and the issue is still occurring with unencrypted traffic.
No patterns in timestamps or Agent Items are being found at all, it seems all random and linked to the start and stop times of these bulk collector tasks (at this point). We’re seeing this on all our items linked on the host.
This is also seen on Windows hosts but with plugin Cpu & plugin WindowsPerfMon (instead of VFSDev). A log snippet of this issue is also attached.
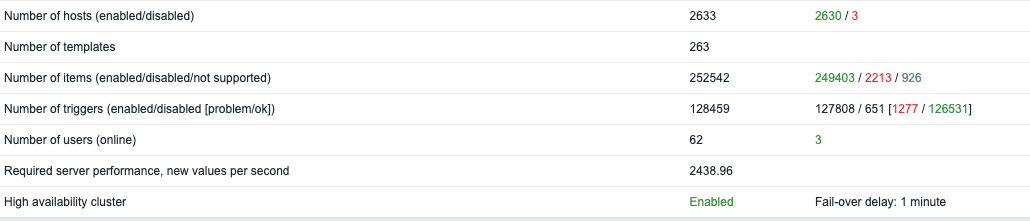
Our infrastructure is fairly new:
- 3000 hosts running Zabbix Agent2 (v6.0.x, v6.2.x) on Linux (Debian) and Windows, mainly consisting of Passive checks (only a very, very small number of active checks are used).
- HA Zabbix Server 6.2.3 (Linux)
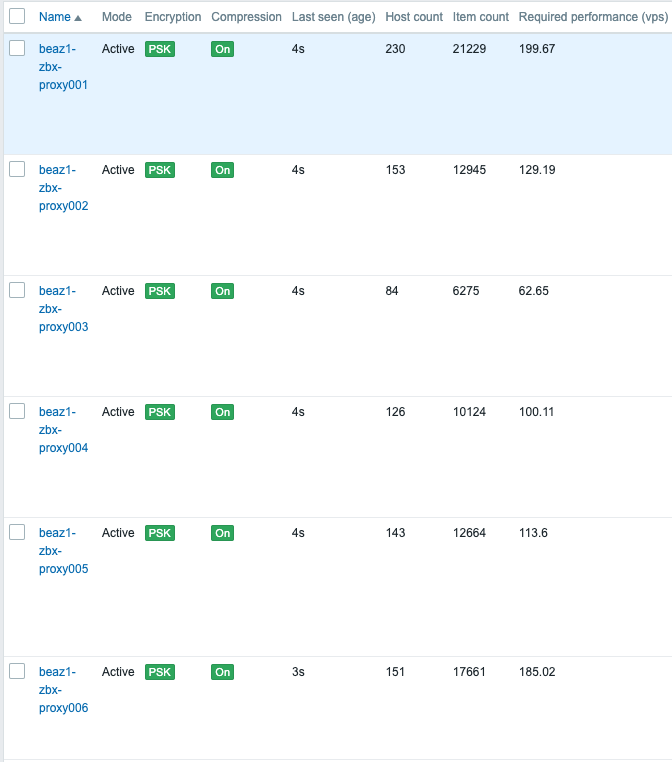
- 20x Zabbix Proxy 6.2.3 (Linux, Debian 11) with MySQL backend
Expectations
No matter the amount of collections the Zabbix Agent2 is executing, it should never be marked ‘unreachable’ or have a ‘first network error, wait for 45 seconds’ on the collector tasks running.
The agent is still reachable & the host is still working (not in heavy CPU / memory load at all), and we’re expecting all the data flowing in nicely just as these collector tasks are not running at all.
Reproducing
- Install Zabbix Agent 2 v6.0.x or v6.2.3 (tested)
- Apply the Zabbix 6.2 templates on these host: Linux by Zabbix agent (Linux) or Windows by Zabbix Agent (Windows)
- Assign a Zabbix Proxy 6.2.3 (running on Linux, Debian 11) to this host
- Wait for errors on the proxy side
Attachments
- CSV of the Zabbix Proxy logs focusing on host ‘web012.ctr’
- Log file of Zabbix Host ‘web012.ctr’ with DebugLevel 5 enabled and LogFileSize=10.
- Log file of a Windows Zabbix Host with DebugLevel 5.