-
Type:
Problem report
-
Resolution: Commercial support required
-
Priority:
 Trivial
-
None
-
Affects Version/s: 6.0.9
-
Component/s: Proxy (P), Server (S)
-
None
-
Environment:Oracle Linux 9, kernel: 5.10.109, db: postgresql13 + Elasticsearch as a history storage, zabbix server version 6.0.6, zabbix proxy version 6.0.9
Hi.
At first I have to report that I have server version 6.0.6 and proxy version 6.0.9. I can't upgrade server to 6.0.9 because it crashes on start https://support.zabbix.com/browse/ZBX-21811
The described problem is also actual for 6.0.6/6.0.6 config.
I am trying to add zabbix proxies to my zabbix server.
I've added over 3000+ hosts on zabbix server after that it starts to delay checks. I've seen a spaces on latest data graphs, delayed checks and so on...
Analyzing self montoring I've seen that server has incufficient pollers.
i've tried to increase caches and pollers and came to this config:
StartPollers=300
StartPreprocessors=300
StartPollersUnreachable=100
StartHistoryPollers=100
StartTrappers=10
StartPingers=100
StartDiscoverers=10
StartHTTPPollers=10
SNMPTrapperFile=/var/log/snmptrap/snmptrap.log
StartSNMPTrapper=1
HousekeepingFrequency=1
CacheSize=6G
HistoryCacheSize=2G
HistoryIndexCacheSize=500M
Timeout=5
UnreachablePeriod=70
UnavailableDelay=120
UnreachableDelay=30
LogSlowQueries=3000
I've got that I have to scale processing to add more hosts.
So I added proxies with the same pollers and caches values as on server.
After a lot of tries and experiments I've managed to get configuration with 1 server and 1proxy which can monitor about 3000 hosts. I 've seen only constant unreachable checks in Queue overview page by proxy.
Self-moitoring graphs were shown less than 50% utilization of pollers and processes.
I've tried to add more hosts and all has been broken. The queues were grown and checks were delayed. I've tried to rollback(delete hosts) to workings number of hosts, but it not helps.
I've removed all hosts and added about 1500 on server and just 10 hosts(including proxy) to one proxy and the 2nd proxy stays empty(only monitors itself with embedded template for proxy).
I see the same result: server has no queues, excepting unreachable checks, that constant, but proxies has queues, even empty proxy.
I've discovered elasticsearch used as history storage, but it has no problems, zabbix logs has no messages about elasticsearch errors or something like this. Also the delayed checks looks right cause for such behavior.
Attached screenshots with graphs and queues are illustrating this situation. Please see the screenshots explanations below:
On zabbix_proxies_with_their_hosts You can see than one proxy is empty and the 2nd proxy has only 10 hosts.
File queue_overview_by_proxy shows queues, especially take an attention on proxies.
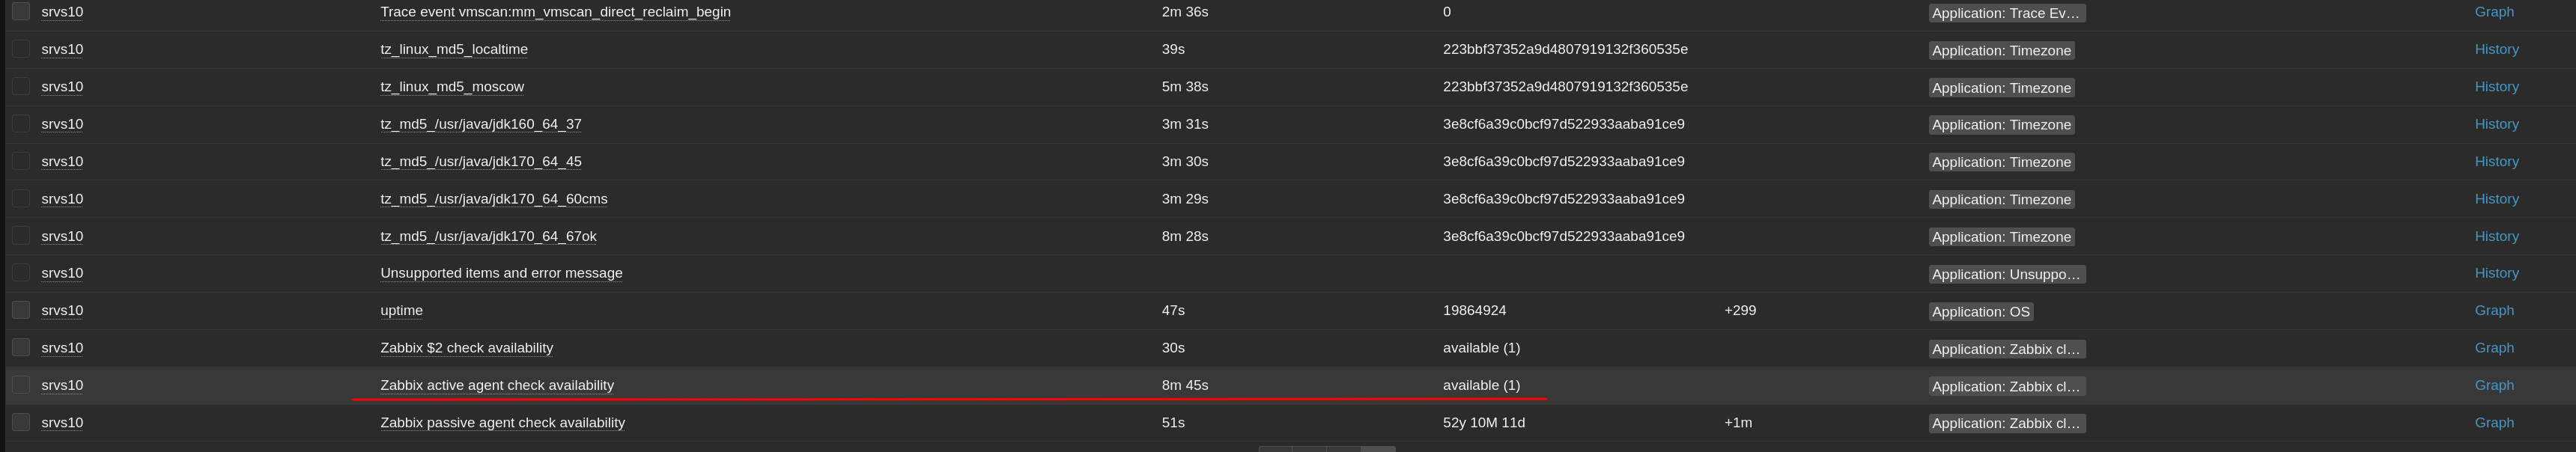
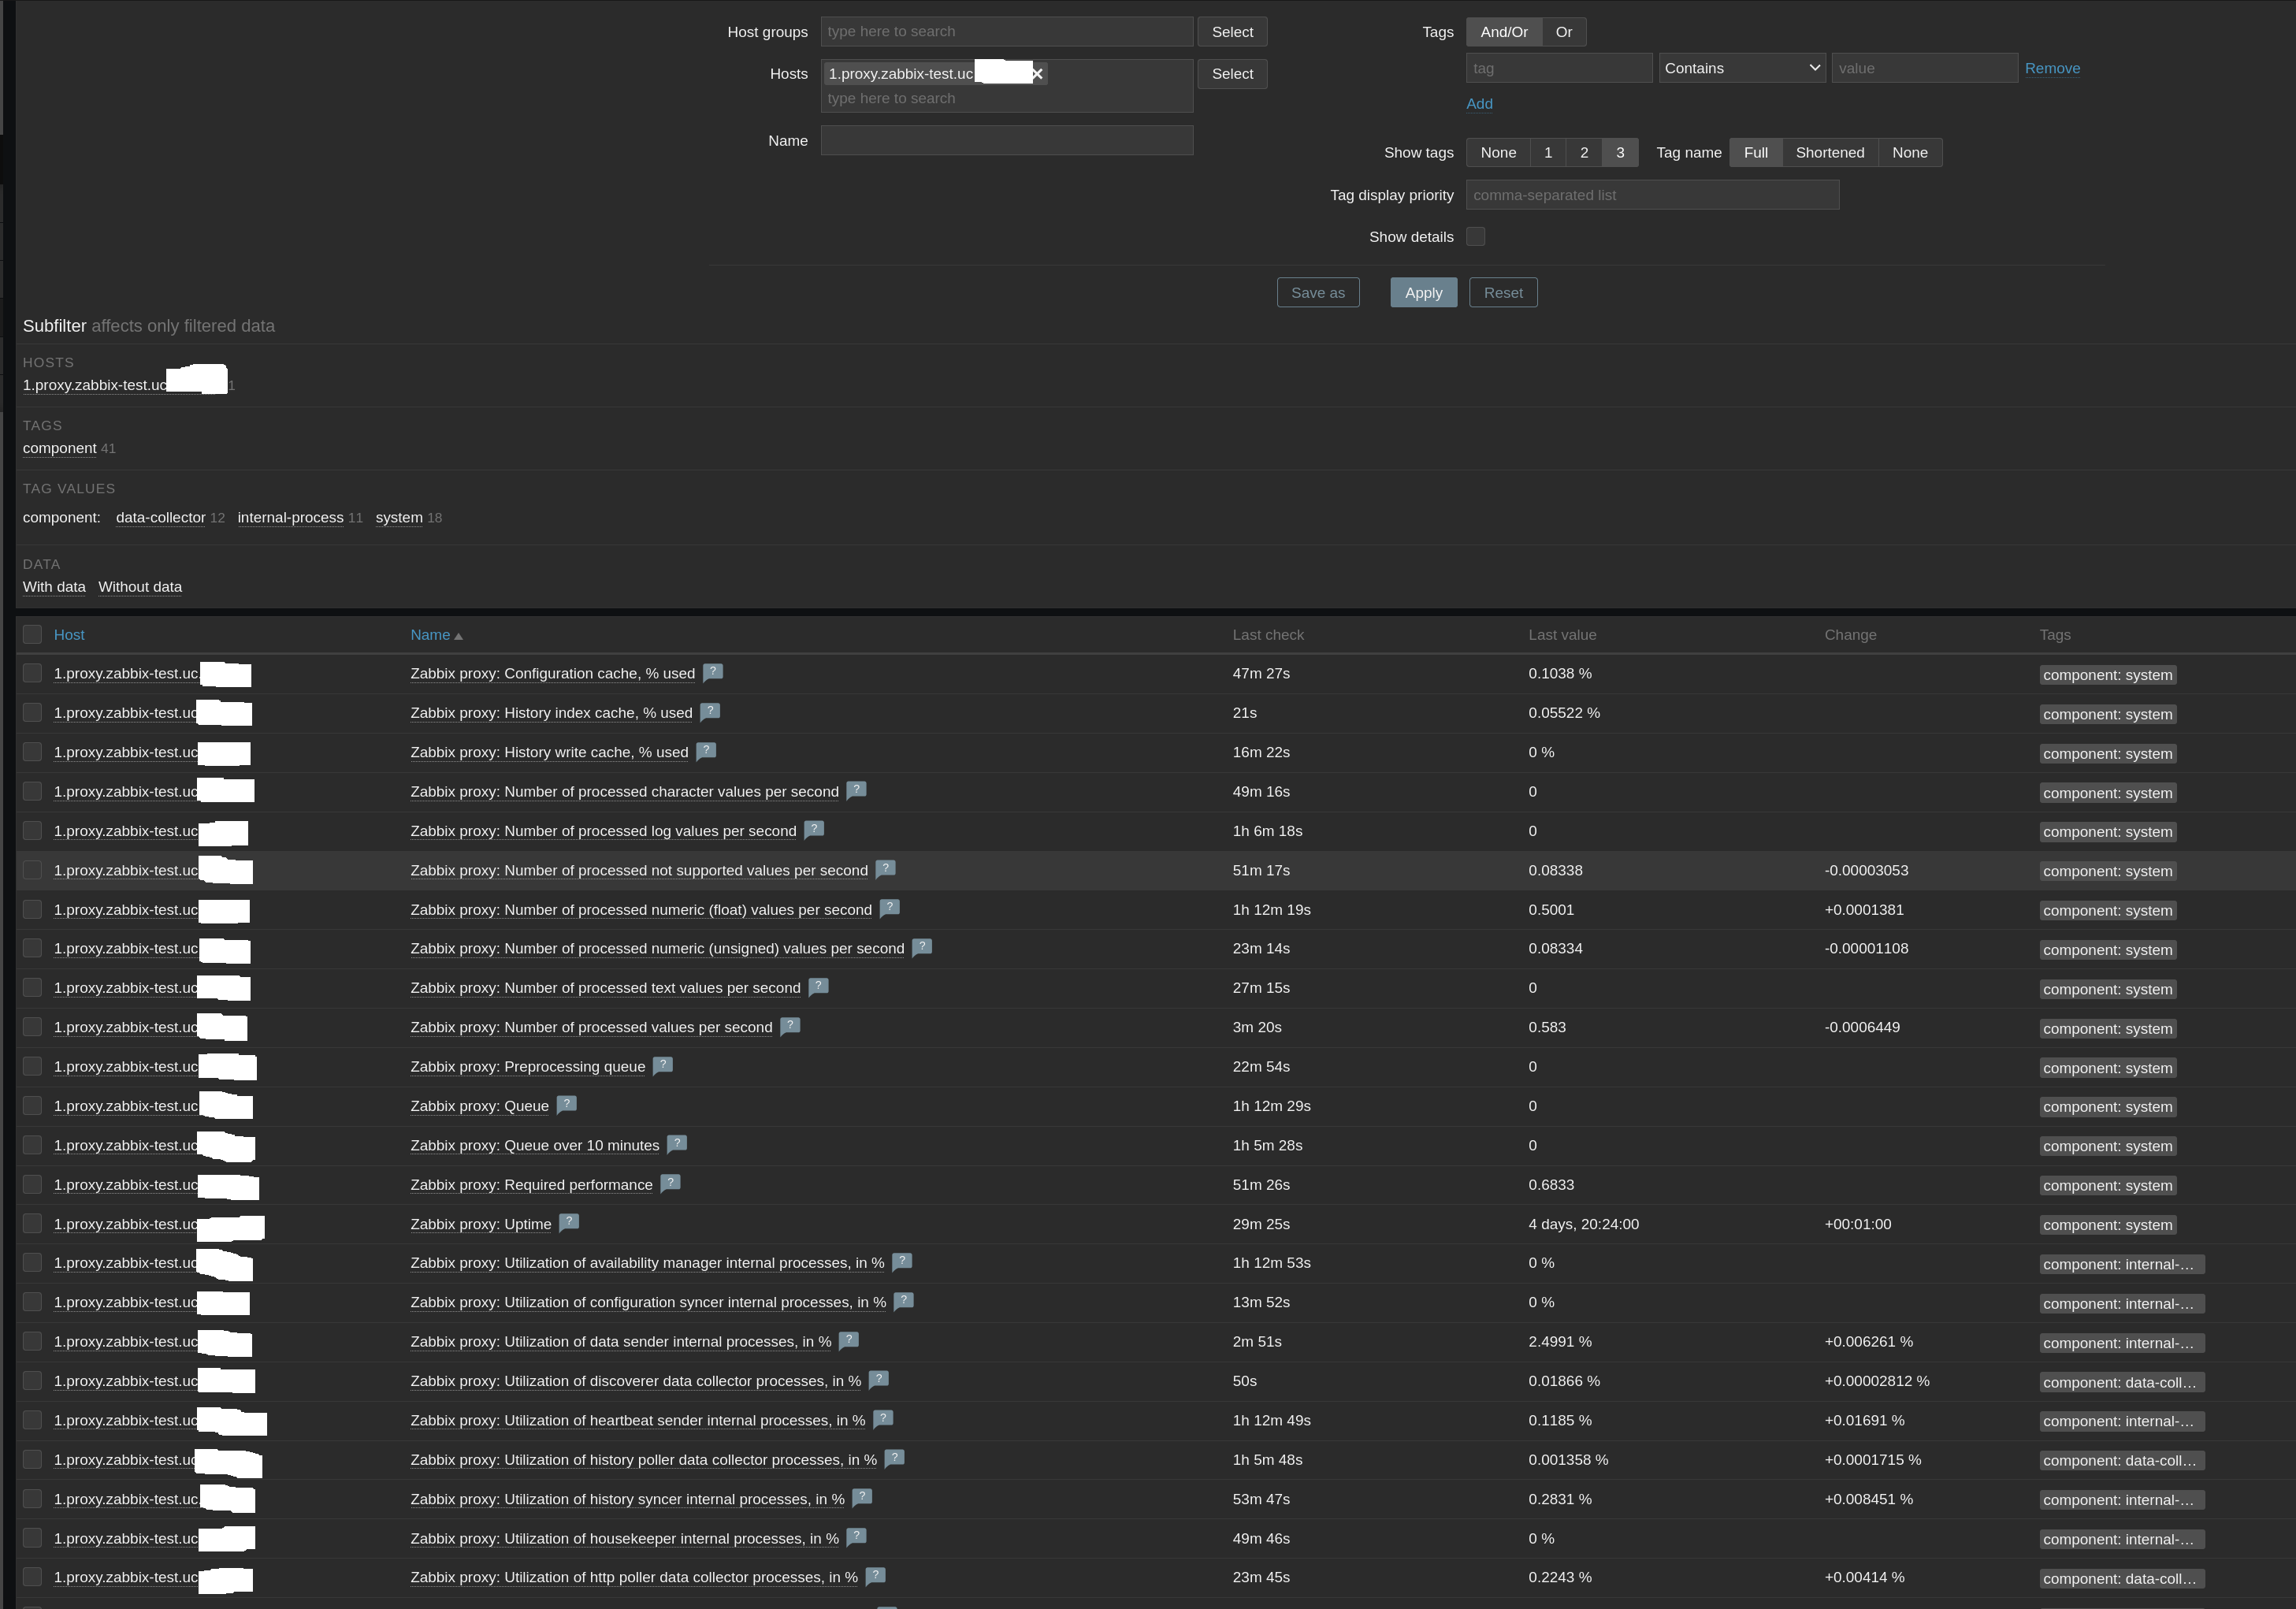
On queue_details_empty_proxy_items You can see that even an empty proxy delays self monitoring checks
On zabbix_proxy_latest_data You can see how long empty proxy delayed the self monitoring checks
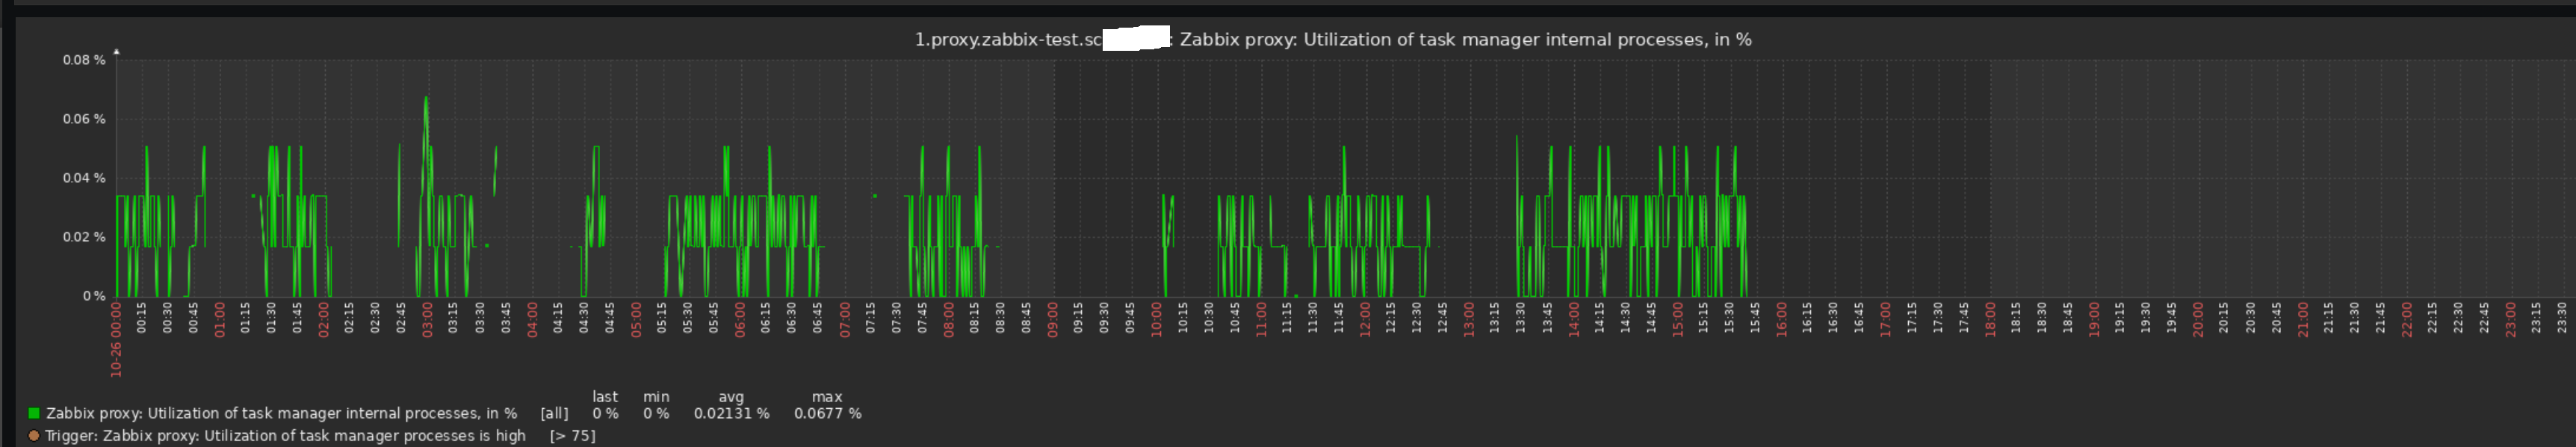
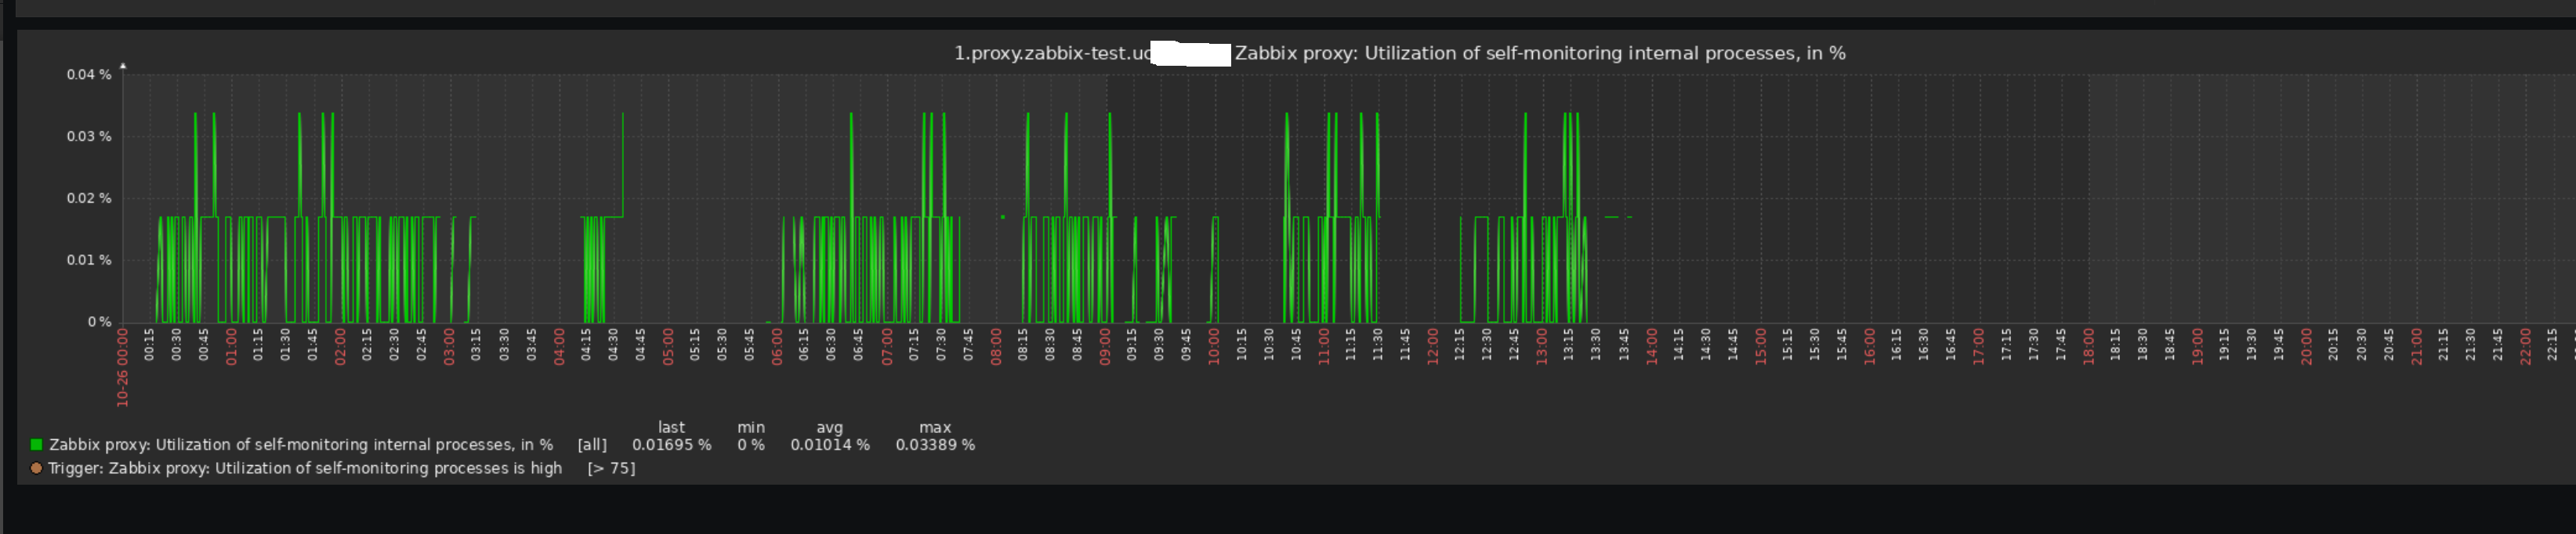
On empty_proxy_self_monitoring_spaces_example You can see the result of theese delayed checks on graphs
On 10_hosts_proxy_self_monitoring_spaces_example You can see the same situation with delayed self monitoring checks on proxy with 10 hosts.
On 10hosts_proxy_availability_check_delay_example You can see one of simple checks which has been delayed by proxy with 10 hosts
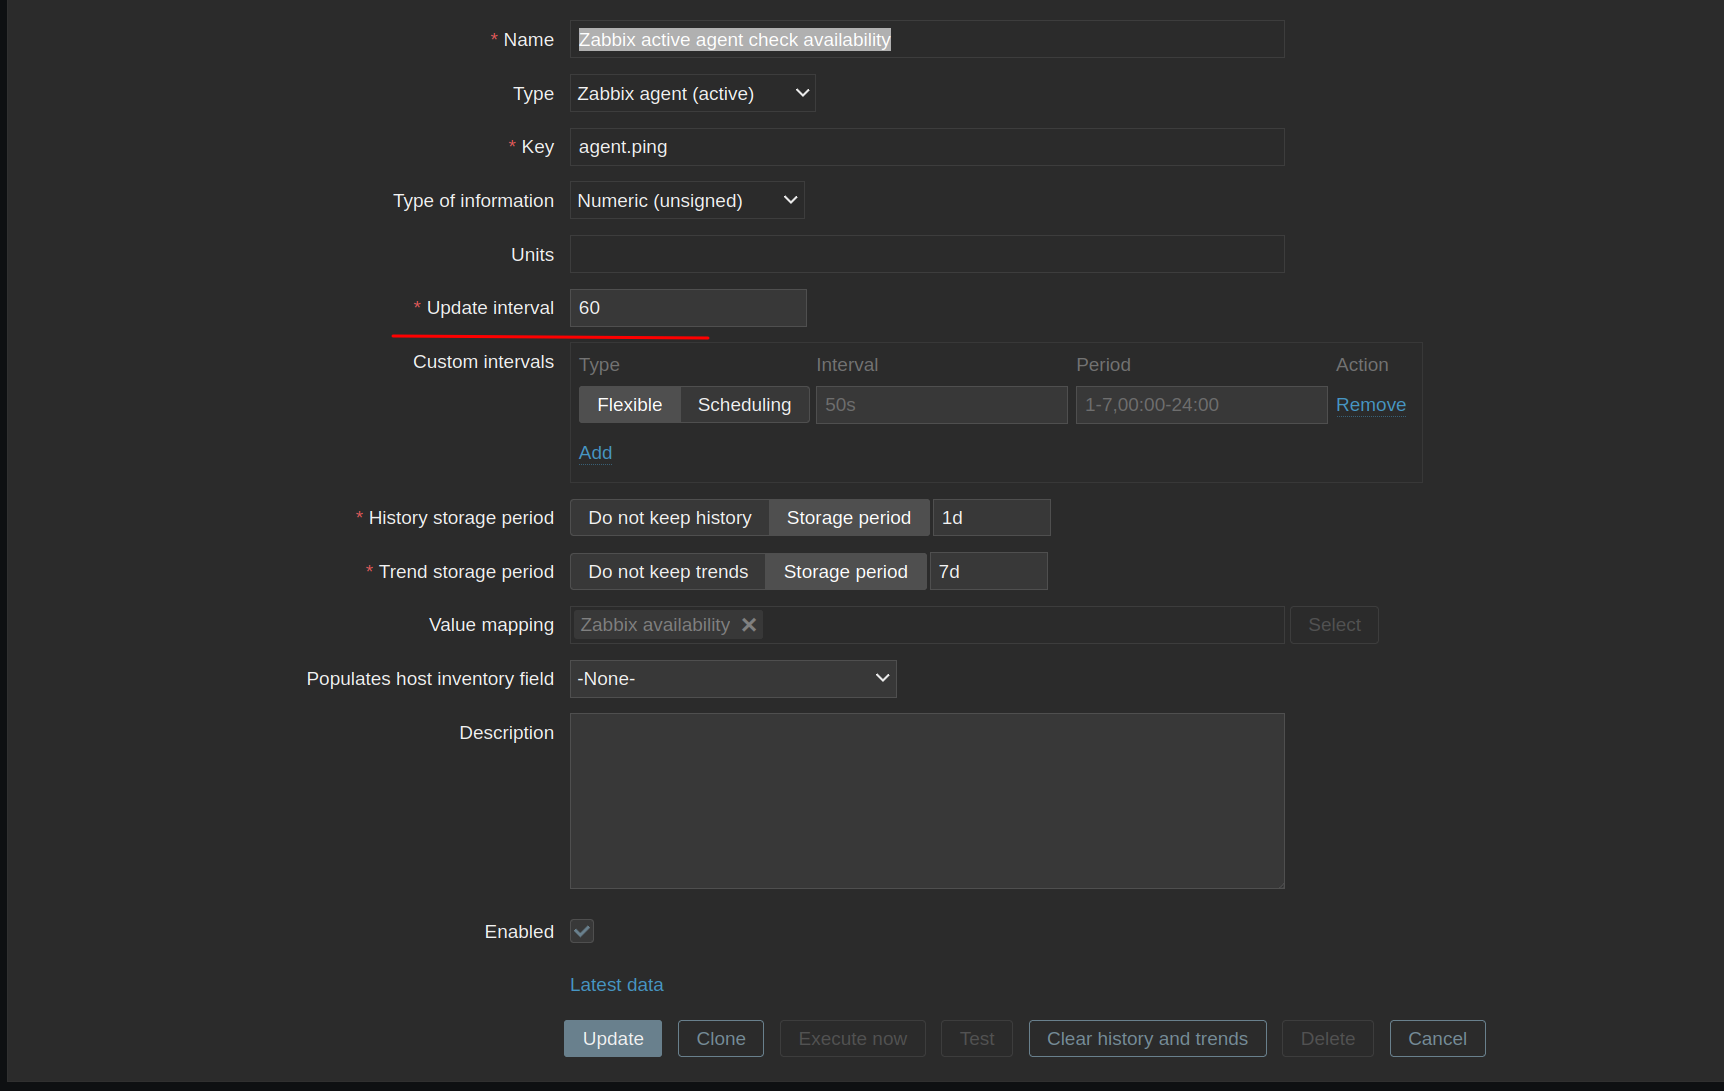
On availability_check_config You can see that availability check ha update interval in 60s, but the last check was about 9m ago
On proxy_monitored_host_item_graph_spaces_example You can see the spaces on graph of one simple item on one of hosts which monitored by proxy
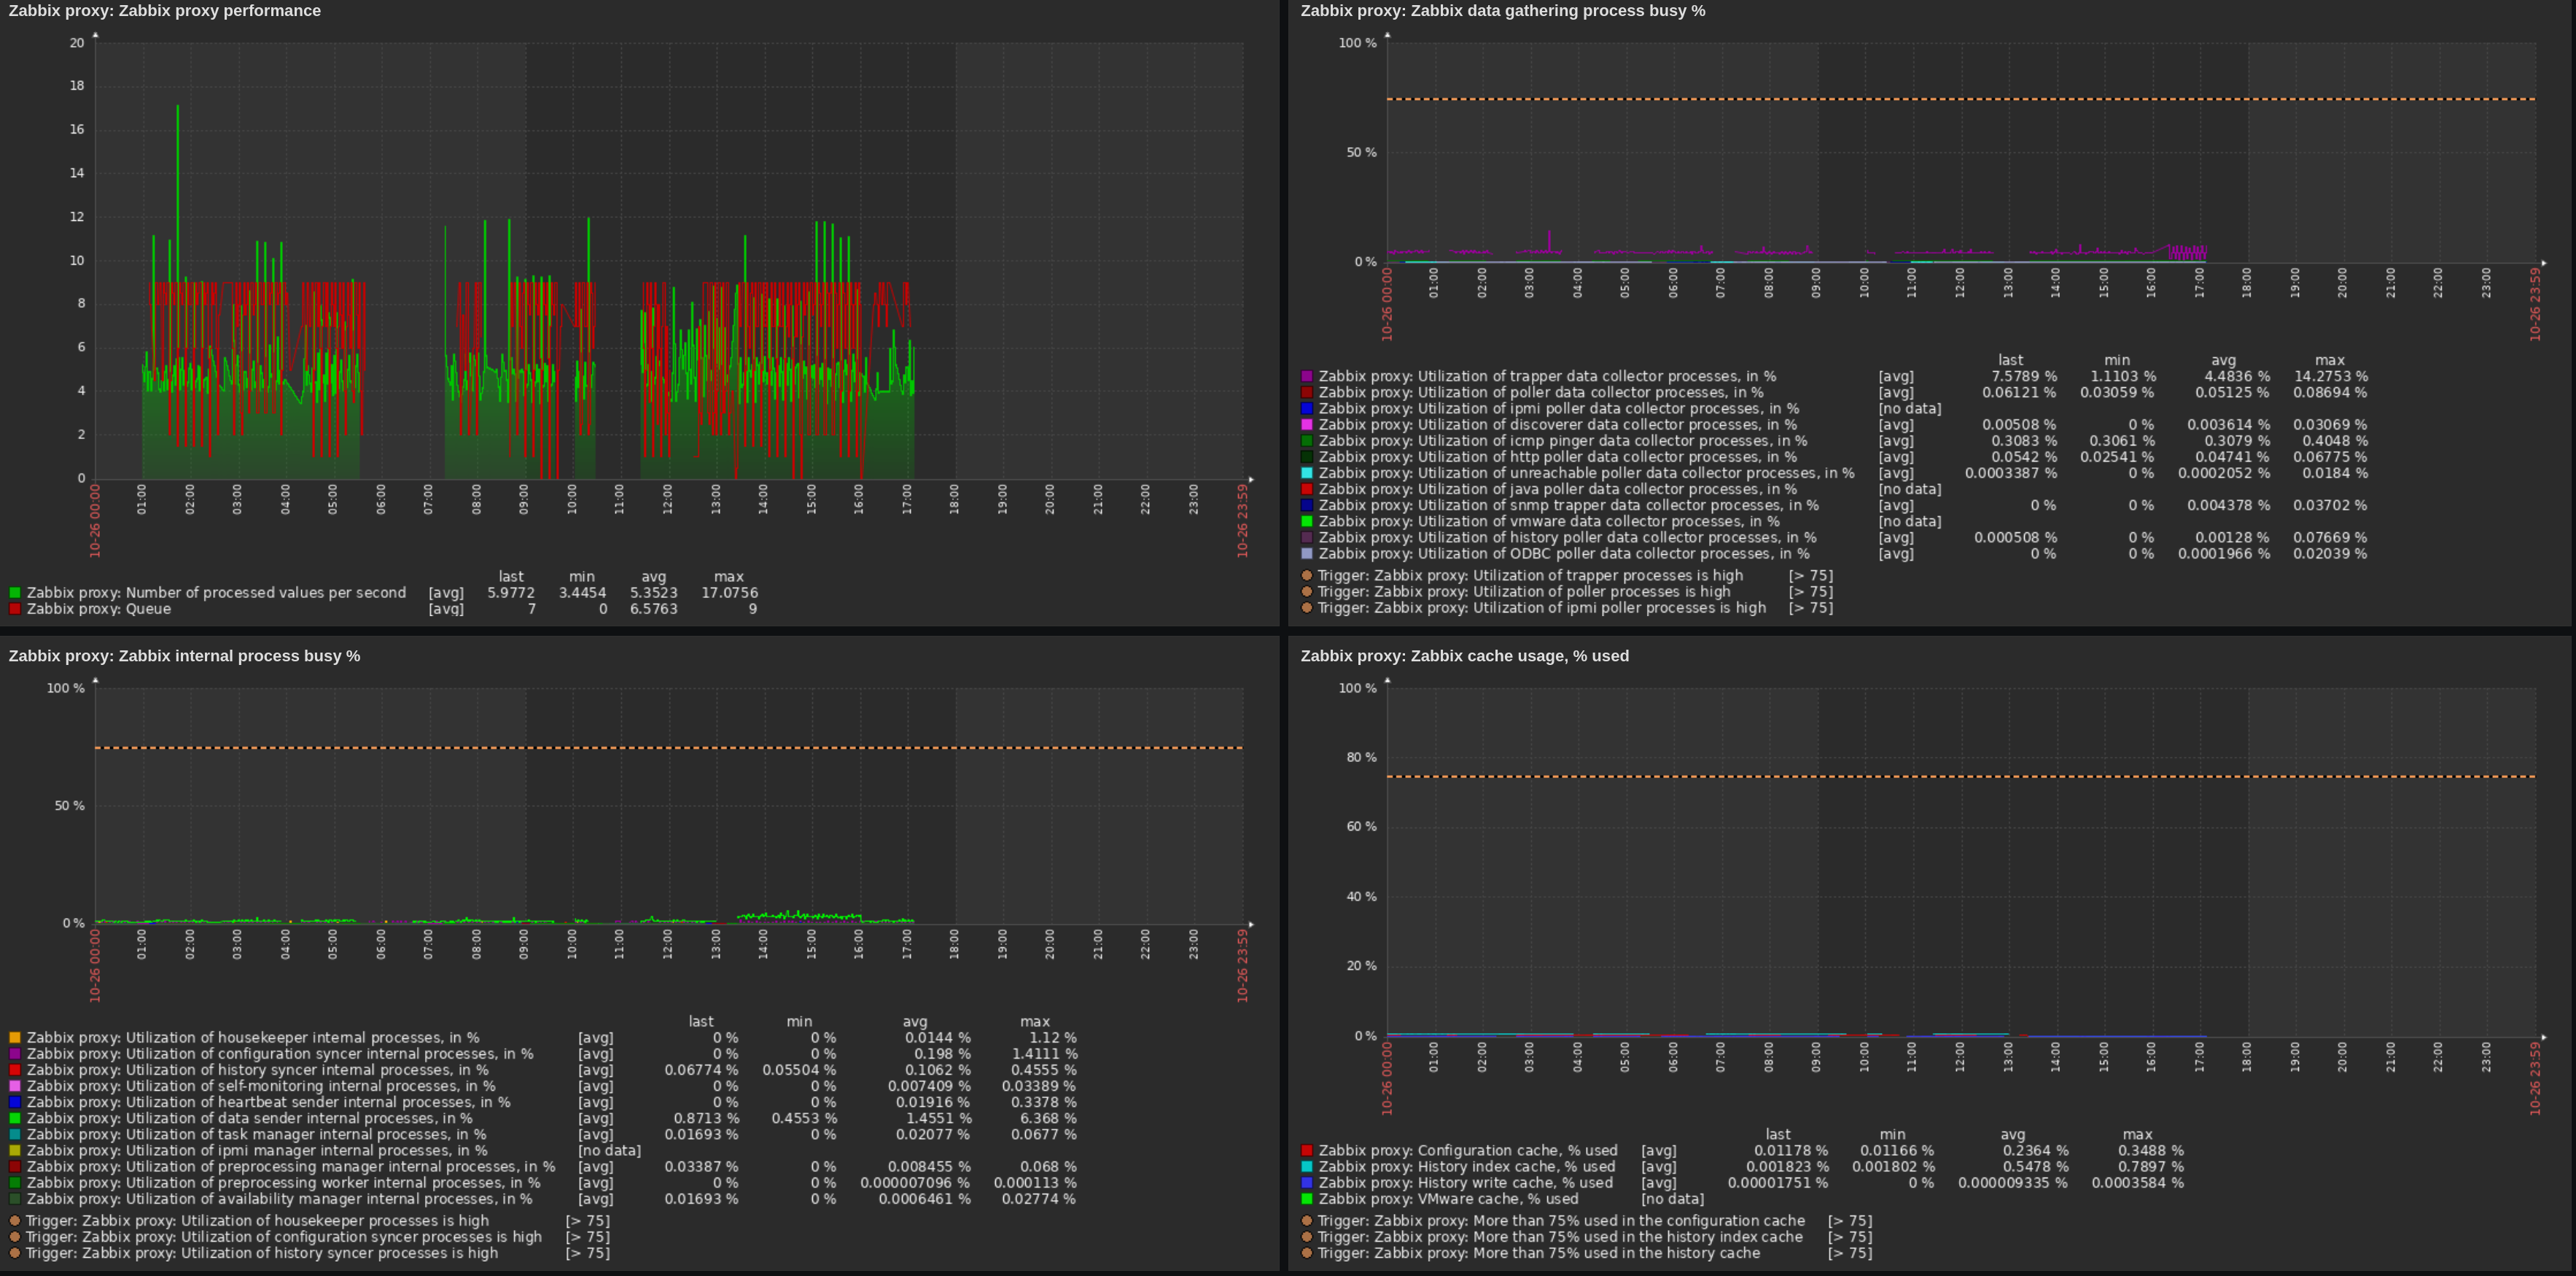
On 10hosts_proxy_dashboard and empty_proxy_dashboard You can see that proxies has no problems with their resources