-
Type:
Problem report
-
Resolution: Cannot Reproduce
-
Priority:
 Trivial
-
None
-
Affects Version/s: 6.0.12
-
Component/s: Frontend (F), Templates (T)
-
None
Steps to reproduce:
- Apply Cisco IOS by SNMP template (for example) to a host
- Let zabbix discover Power Supplies (for example) and collect values for 3 days
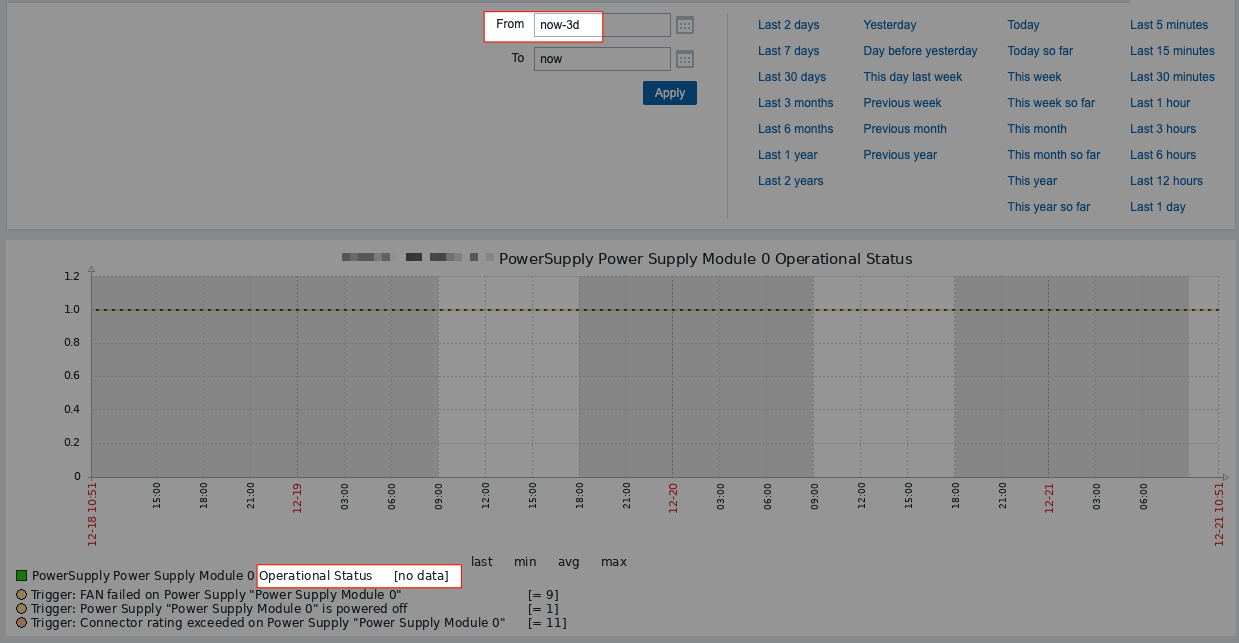
- Clic on Latest data
- Click on Graph near to a power supply item
- Select now-3d in the time filter
Result:
- The graph is empty and legend shows "no data".
- Users complain because they can't see graphs for periods > last 2 days.
Expected:
- The graph shows the item values for the 3 days (which actually are in the database, because item history is 7d).
Cause:
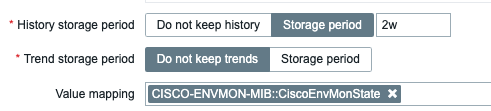
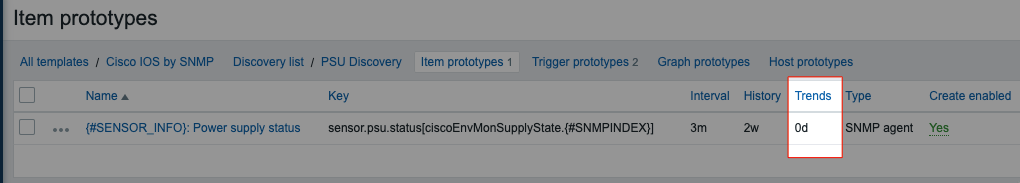
- The template has this item prototype configured with "Do not keep trends".
- Zabbix frontend uses trends to generate graphs for periods larger than 2 days.
- Thus these graphs cannot be generated.
Additional note:
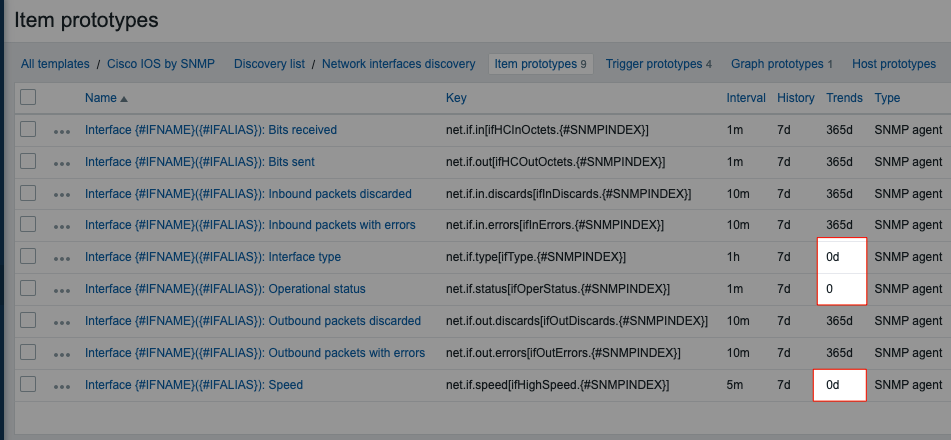
Several items in recente official templates have "Do not keep trends", while there seems to be no reason to use this setting.