-
Type:
Problem report
-
Resolution: Commercial support required
-
Priority:
 Trivial
-
None
-
Affects Version/s: 6.0.13
-
Component/s: Server (S)
-
Environment:New: Alma 8.7 / Kernel 4.18.0-425.10.1.el8_7.x86_64
vSphere 6.5 based VM 6vCPU / 80Gbytes RAM
Zabbix Release 6.0.13
MariaDB-server-10.5.19-1
Overview
The database and all related config files/scripts were dumped from a Ubuntu 16 instance running the latest version of 4.4.40 to an Alma 8 server also running 4.4.410, then IP swapped and subsequently upgraded to 6.0.13. The procedure was extensively sandbox tested and no problems were encountered on our PreProd environment, but
When it came to Prod however, after a number of hours, on average 6-8 the Zabbix service hangs, reports multitude of "Agent Unreachable errors" in the GUI from all the client servers and stops recording data.
There's no evidence of issues with OS level resource on the box, load average generally sits around 2 with a slightly bump during housekeeping, and the box is using no more than 30Gbytes of RAM (MySQL has been tuned and less that 50% of the InnoDB buffer pool is in use and no sign of IO wait.
What leads me to believe this may be a bug is the scant mount of identifiable evidence in either performance monitoring, monitoring of Zabbix caches and internals, or the Zabbix server log, which has been tried at both levels 3 and 4. Whatever happens, it seem to happen fast, with very little time for the processes on the box to respond or log errors.
Possible Evidence/Indicators
The only evidence of errors I've been able to find in the Zabbix log file are some of the following errors, mostly around the time of restarts, which I've traced back to the HA Manager process:
2640:20230301:143620.171 cannot write to IPC socket: Broken pipe
Based on Forum advice I've tried upping the Open File ulimit for the Zabbix user from default of 1024 (same value as the other servers) to 4096, both in the control file and the SystemD unit file. We're not the biggest user of Zabbix, our box servers perhaps 1000 hosts, so it seems unlikely to me that ulimit issues are a factor here, in my experience these are rare these days with standard software installs, and no ulimit increases were in play on either the original box, my sandbox lab or my pre-prod server.
An strace on the HA process leads to a seemingly defunct file handle:
14:36:20 epoll_wait(11, [\\{events=EPOLLIN|EPOLLHUP, data={u32=19, u64=19}}], 32, 974) = 1
14:36:20 read(19, "\4\0\0\0\0\0\0\0", 4096) = 8
14:36:20 read(19, "", 4096) = 0
14:36:20 epoll_ctl(11, EPOLL_CTL_DEL, 19, 0x7ffdb1a03c8c) = 0
14:36:20 write(19, "\4\0\0\0\v\0\0\0\0\0\0\0\3\0\0\0[]\0", 19) = -1 EPIPE (Broken pipe)
14:36:20 — SIGPIPE {si_signo=SIGPIPE, si_code=SI_USER, si_pid=2640, si_uid=990}---
14:36:20 rt_sigprocmask(SIG_BLOCK, [HUP INT QUIT USR1 USR2 TERM], [], 8) = 0
14:36:20 stat("/var/log/zabbix/zabbix_server.log", {st_mode=S_IFREG|0664, st_size=
549576353, ...}) = 0
14:36:20 openat(AT_FDCWD, "/var/log/zabbix/zabbix_server.log", O_RDWR|O_CREAT|O_APPEND, 0666) = 20
14:36:20 getpid() = 2640
14:36:20 fstat(20, {st_mode=S_IFREG|0664, st_size=549576353, ...}) = 0
14:36:20 write(20, " 2640:20230301:143620.171 canno"..., 67) = 67
14:36:20 close(20) = 0
14:36:20 rt_sigprocmask(SIG_SETMASK, [], NULL, 8) = 0
14:36:20 epoll_wait(15,
[root@dca-zabbix zabbix]# ls -l /proc/2640/fd
total 0
lr-x------. 1 root root 64 Mar 1 14:38 0 -> /dev/null
l-wx------. 1 root root 64 Mar 1 14:38 1 -> /var/log/zabbix/zabbix_server.log
lrwx------. 1 root root 64 Mar 1 14:38 10 -> 'socket:[28603]'
lrwx------. 1 root root 64 Mar 1 14:38 11 -> 'anon_inode:[eventpoll]'
lr-x------. 1 root root 64 Mar 1 14:38 12 -> 'pipe:[28605]'
l-wx------. 1 root root 64 Mar 1 14:38 13 -> 'pipe:[28605]'
lrwx------. 1 root root 64 Mar 1 14:38 14 -> 'socket:[28606]'
lrwx------. 1 root root 64 Mar 1 14:38 15 -> 'anon_inode:[eventpoll]'
lr-x------. 1 root root 64 Mar 1 14:38 16 -> 'pipe:[28607]'
l-wx------. 1 root root 64 Mar 1 14:38 17 -> 'pipe:[28607]'
lrwx------. 1 root root 64 Mar 1 14:29 18 -> 'socket:[28608]'
l-wx------. 1 root root 64 Mar 1 14:38 2 -> /var/log/zabbix/zabbix_server.log
lr-x------. 1 root root 64 Mar 1 14:38 3 -> '/var/lib/sss/mc/passwd (deleted)'
lr-x------. 1 root root 64 Mar 1 14:38 4 -> '/var/lib/sss/mc/initgroups (deleted)'
l-wx------. 1 root root 64 Mar 1 14:38 5 -> /run/zabbix/zabbix_server.pid
lrwx------. 1 root root 64 Mar 1 14:38 6 -> 'socket:[29394]'
lrwx------. 1 root root 64 Mar 1 14:38 7 -> 'anon_inode:[eventpoll]'
lr-x------. 1 root root 64 Mar 1 14:38 8 -> 'pipe:[29396]'
l-wx------. 1 root root 64 Mar 1 14:38 9 -> 'pipe:[29396]'
The only other possible indicators are intermittent bursts of the following MySQL error often in the minutes preceding the hang.
2023-03-01 12:10:00 80772 [Warning] Aborted connection 80772 to db: 'zabbix' user: 'zabbix' host: 'localhost' (Got timeout reading communication packets)
2023-03-01 12:10:00 80773 [Warning] Aborted connection 80773 to db: 'zabbix' user: 'zabbix' host: 'localhost' (Got timeout reading communication packets)
2023-03-01 12:10:00 80774 [Warning] Aborted connection 80774 to db: 'zabbix' user: 'zabbix' host: 'localhost' (Got timeout reading communication packets)
I believe however these are either idle connections timing out, or if they are related to the issue they are a symptom rather than a cause, there is no sign of any other problem MySQL side.
A restart of the zabbix-server process brings the service back.
However, from the time of the first restart the zabbix-server refused to respond correctly to restarts via SystemD and at the advice of various forum posts added the following to the Unit file for the time being.
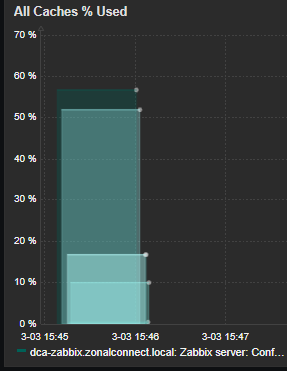
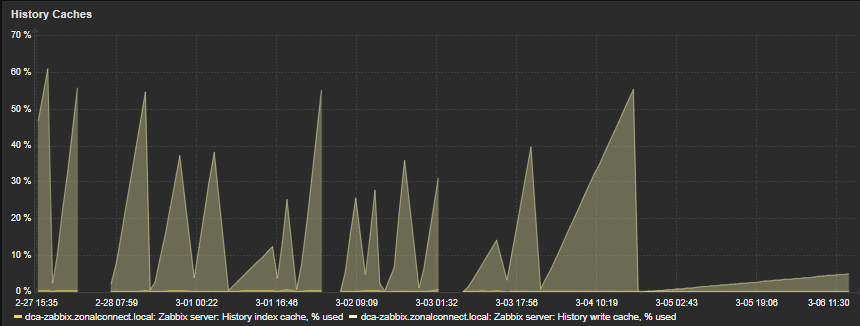
I have observed the odd backlog of SNMP checks in the queue lasting seconds or minutes however the box is reporting no errors relating to poller busyness or similar, and none of the configured caches on the server have been above 60% full at the time of the hangs. The new 6.0 Template has been installed so I have visibility on those new metrics.
I apologies in advance I have not been able to prove precise steps for replication as such, but I have very little to go on currently. I am however happy to assist with any data gathering steps that might be helpful, and I can supply further server logs on request.
Thanks in advance.