-
Type:
Problem report
-
Resolution: Fixed
-
Priority:
 Minor
Minor
-
Affects Version/s: 6.0.17
-
Component/s: Frontend (F)
-
Environment:PHP 8.1+
-
S25-W18/19, S25-W22/23, S25-W24/25, S25-W26/27, S25-W28/29, S25-W30/31, S25-W34/35, S25-W36/37
-
2
We have identified an inconsistency in rendering trend data graphs after upgrading to the version of PHP (8.0 -> 8.1+)
Please see the attached images for reference:
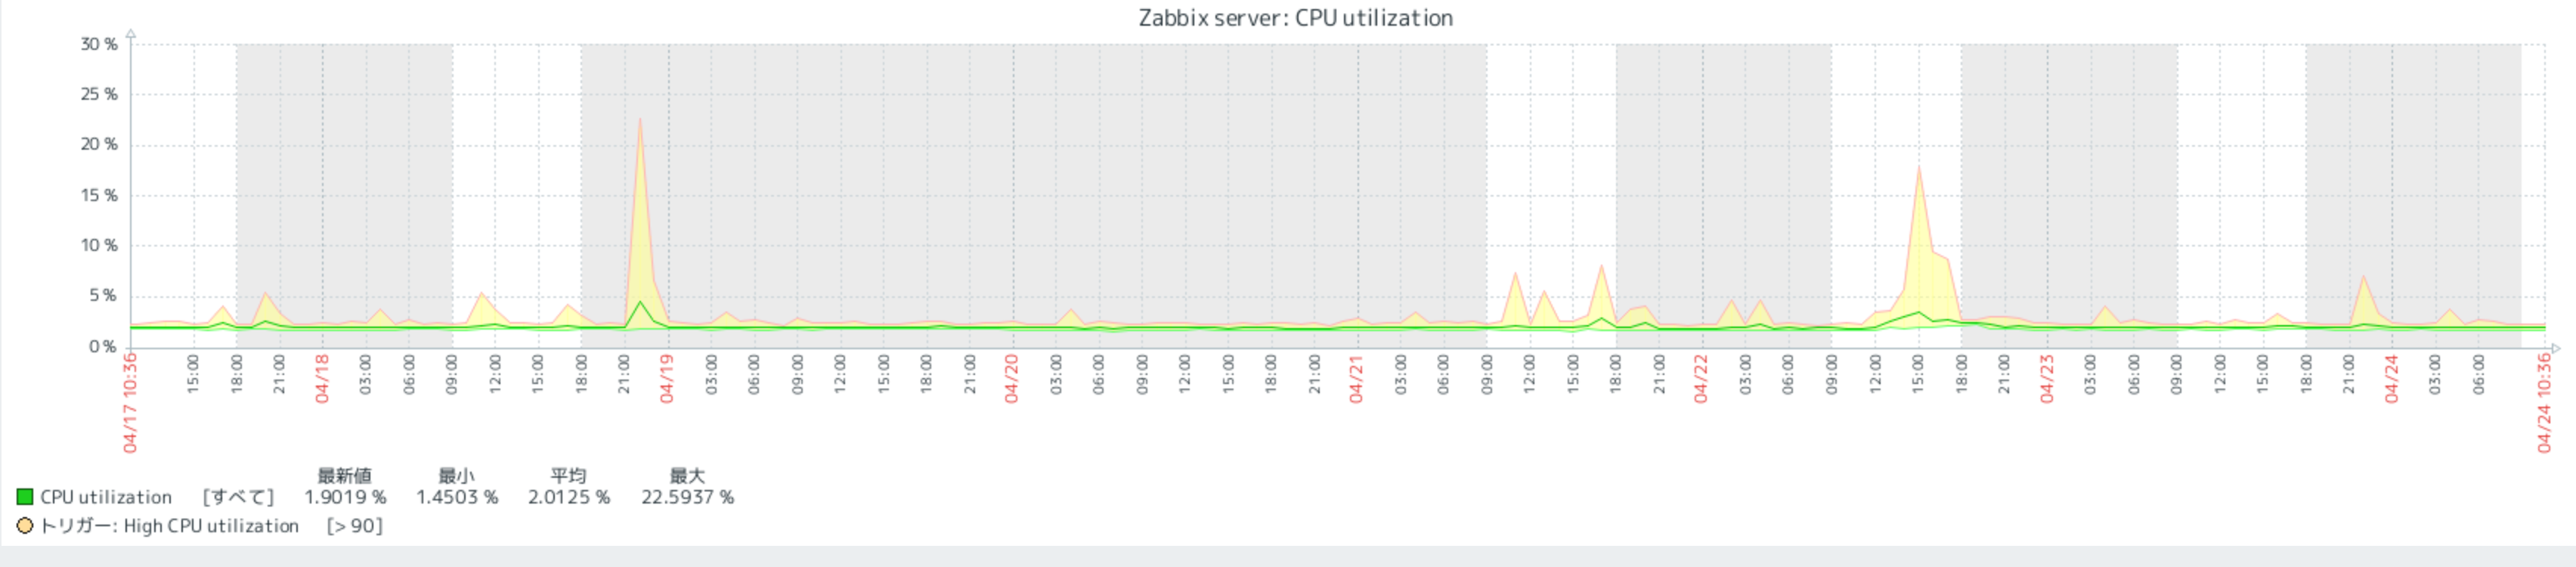
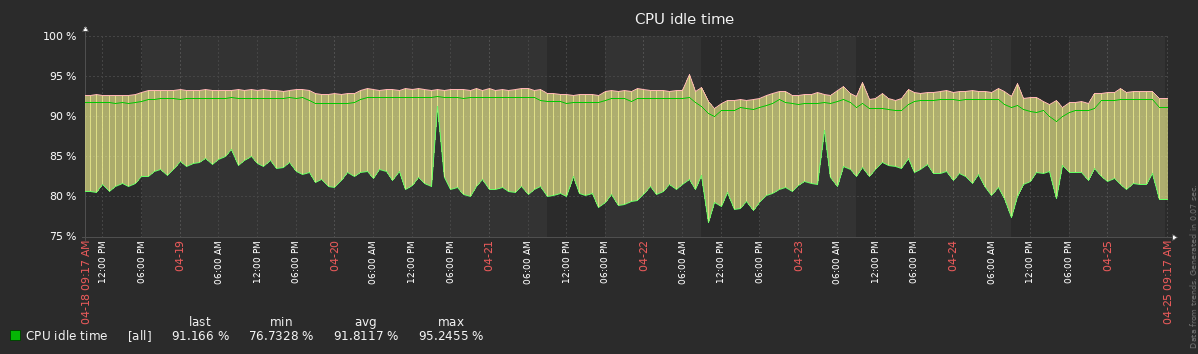
- Previous PHP versions (~8.0)

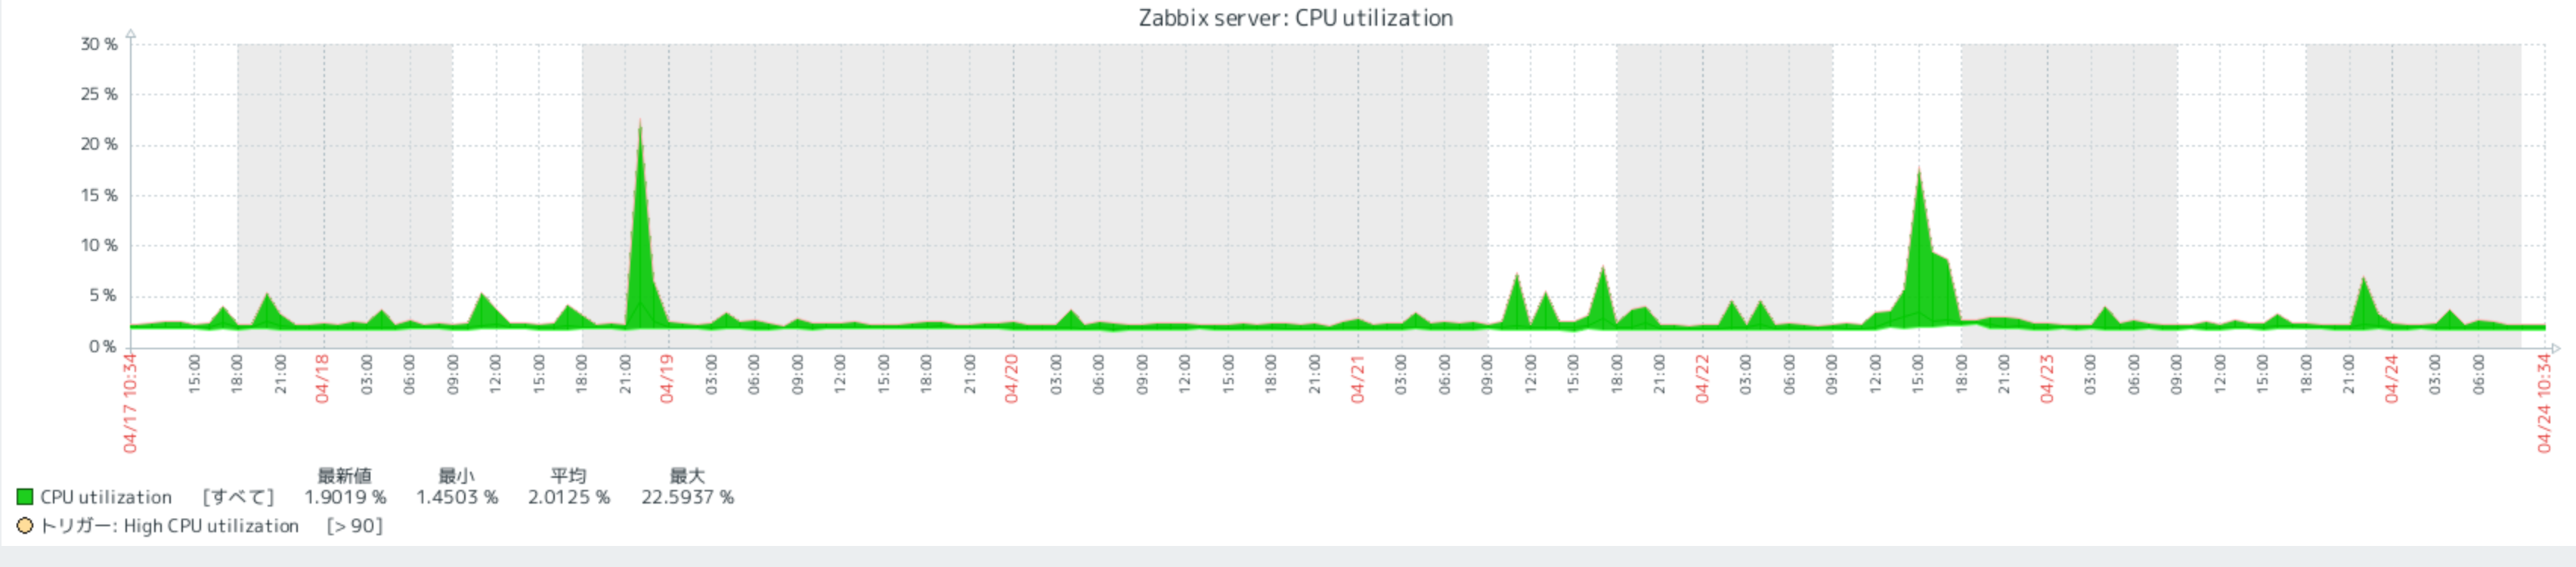
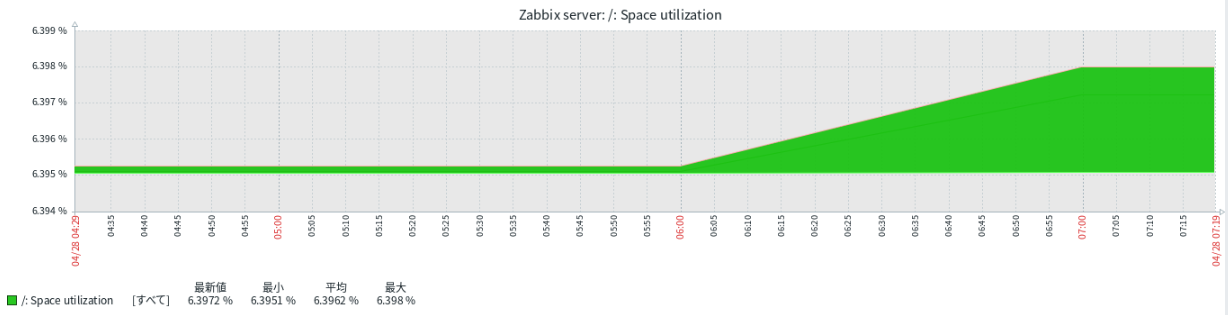
- PHP version 8.1 and above (8.1.19, 8.2.6)

In Zabbix documentation,
For data that show a longer period three lines are drawn - a dark green one shows the average, while a light pink and a light green line shows the maximum and minimum values at that point in time. The space between the highs and the lows is filled with yellow background.
https://www.zabbix.com/documentation/6.0/en/manual/config/visualization/graphs/simple
However, after upgrading to PHP 8.1 and above, this documented behavior isn't observed.

- caused by
-
ZBXNEXT-7722 Runtime errors when using Zabbix with php8.1
-

- Closed
-

