-
Type:
Problem report
-
Resolution: Fixed
-
Priority:
 Critical
-
Affects Version/s: 6.4.2, 6.4.3, 7.0.0alpha5
-
Component/s: Agent (G)
-
Environment:Tested under: OEL 7-9/RHEL 7-9/CENTOS 7,8, x86_64
Packaged: via official RPM and self compiles
Agent2 Versions Tested: 6.2+ unti 6.4.3
-
Sprint 104 (Sep 2023)
-
1
Description:
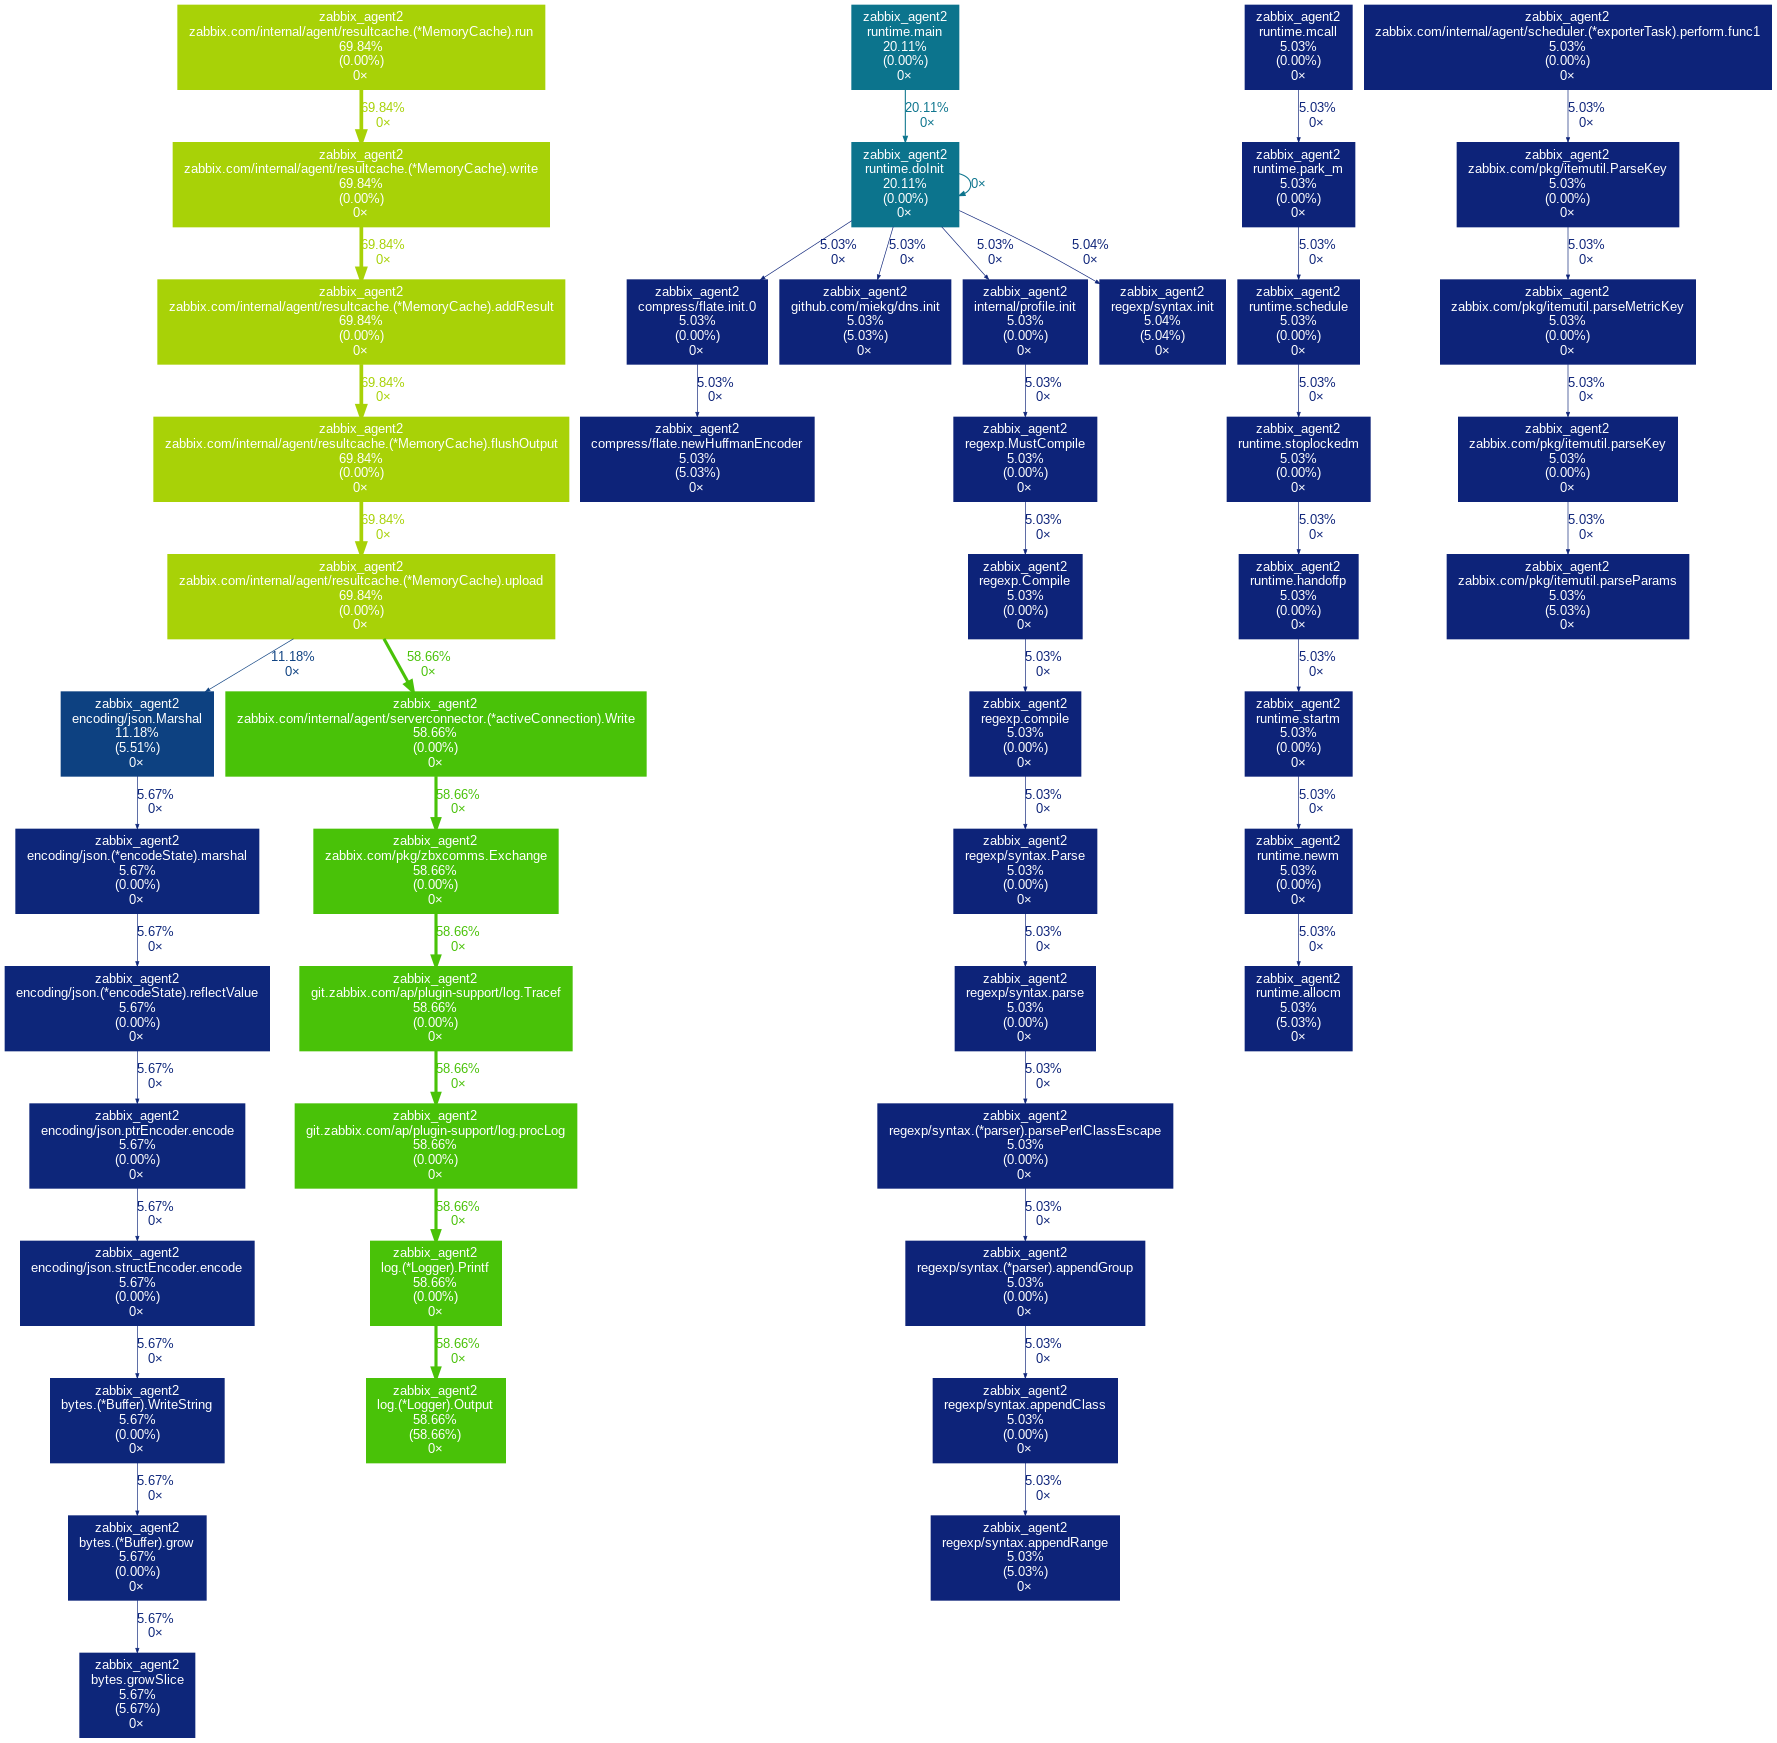
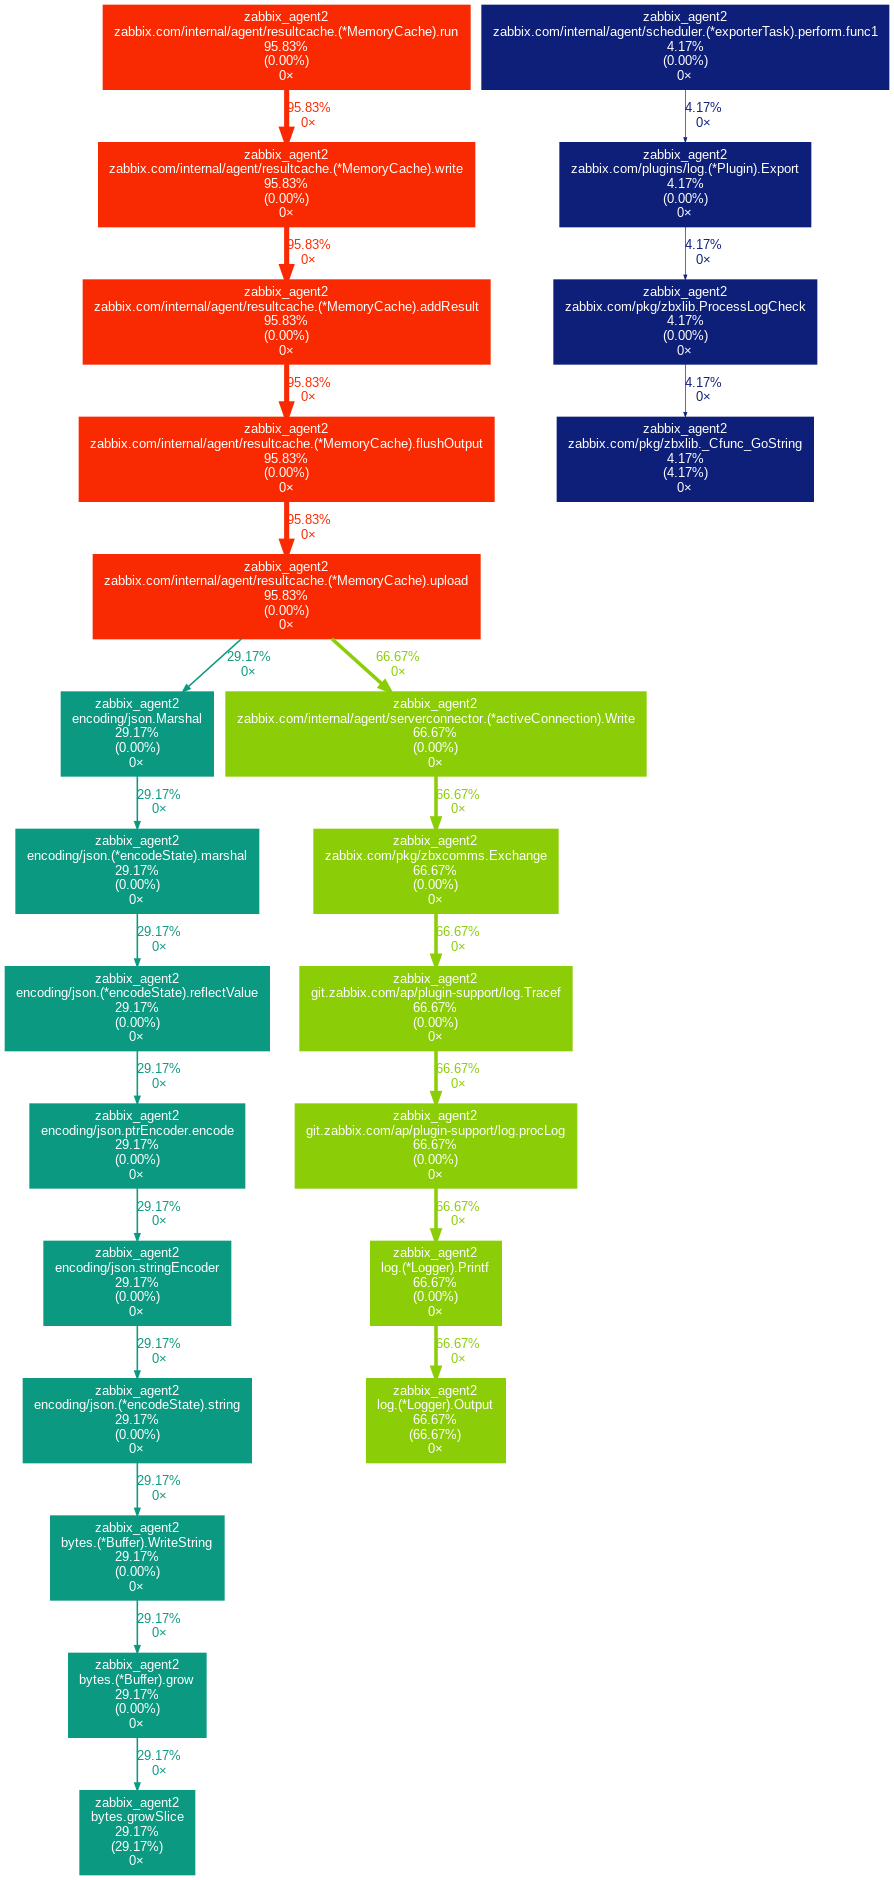
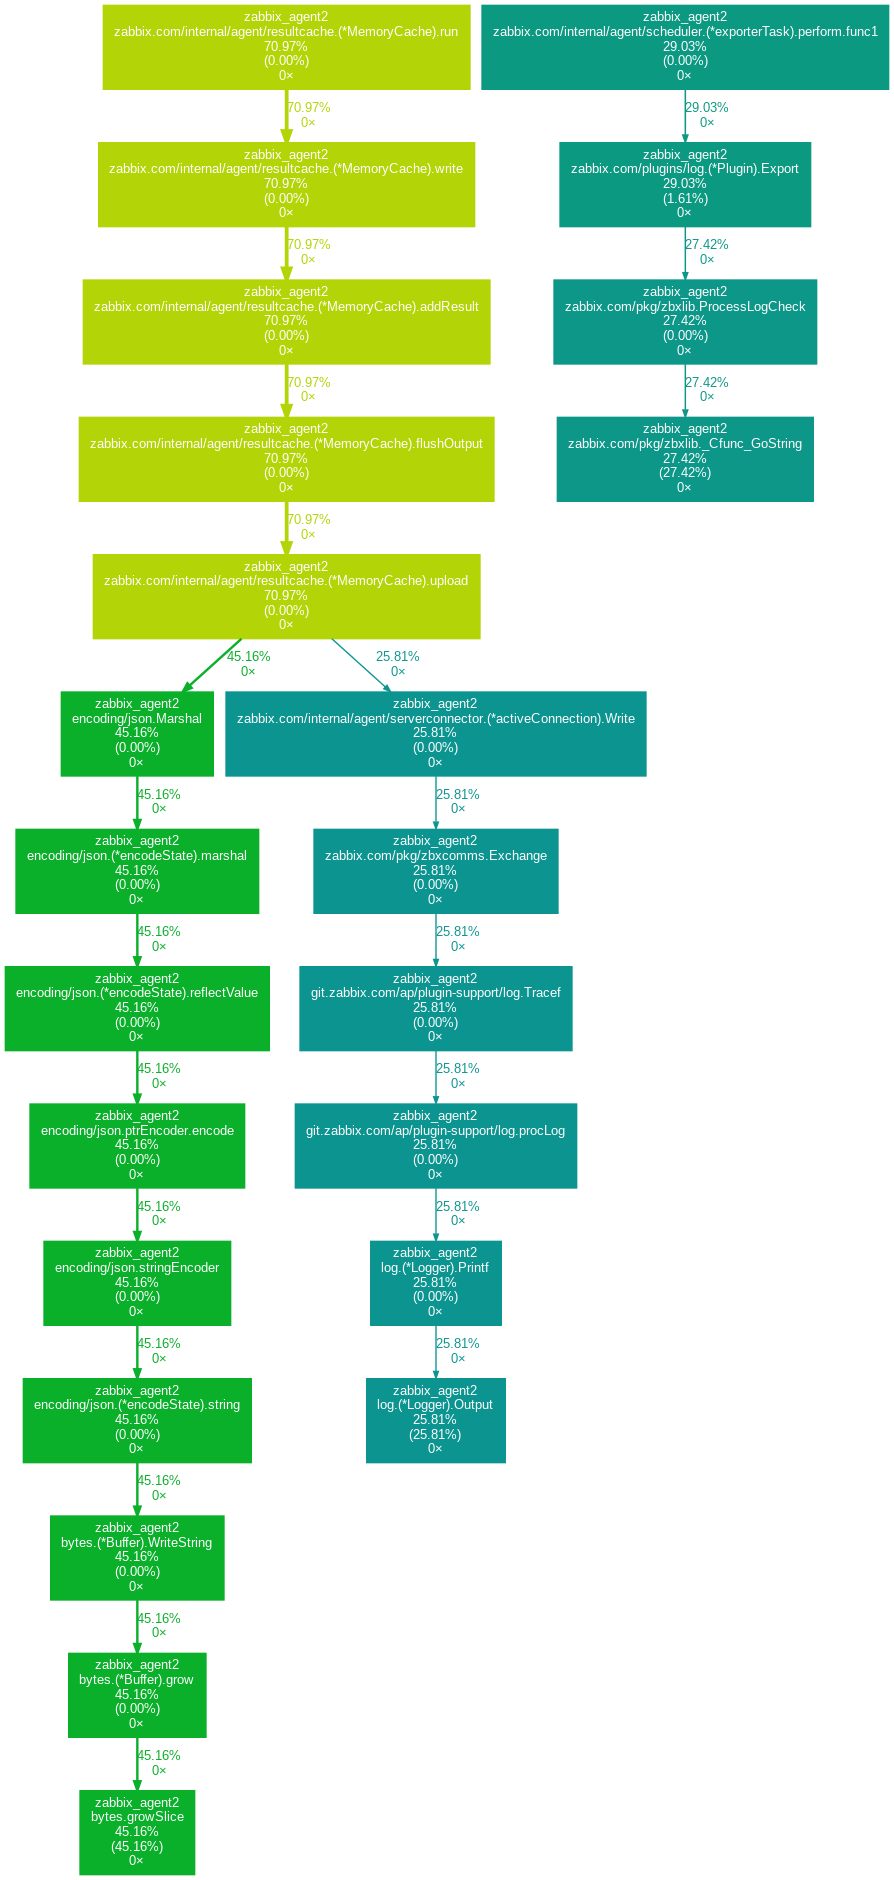
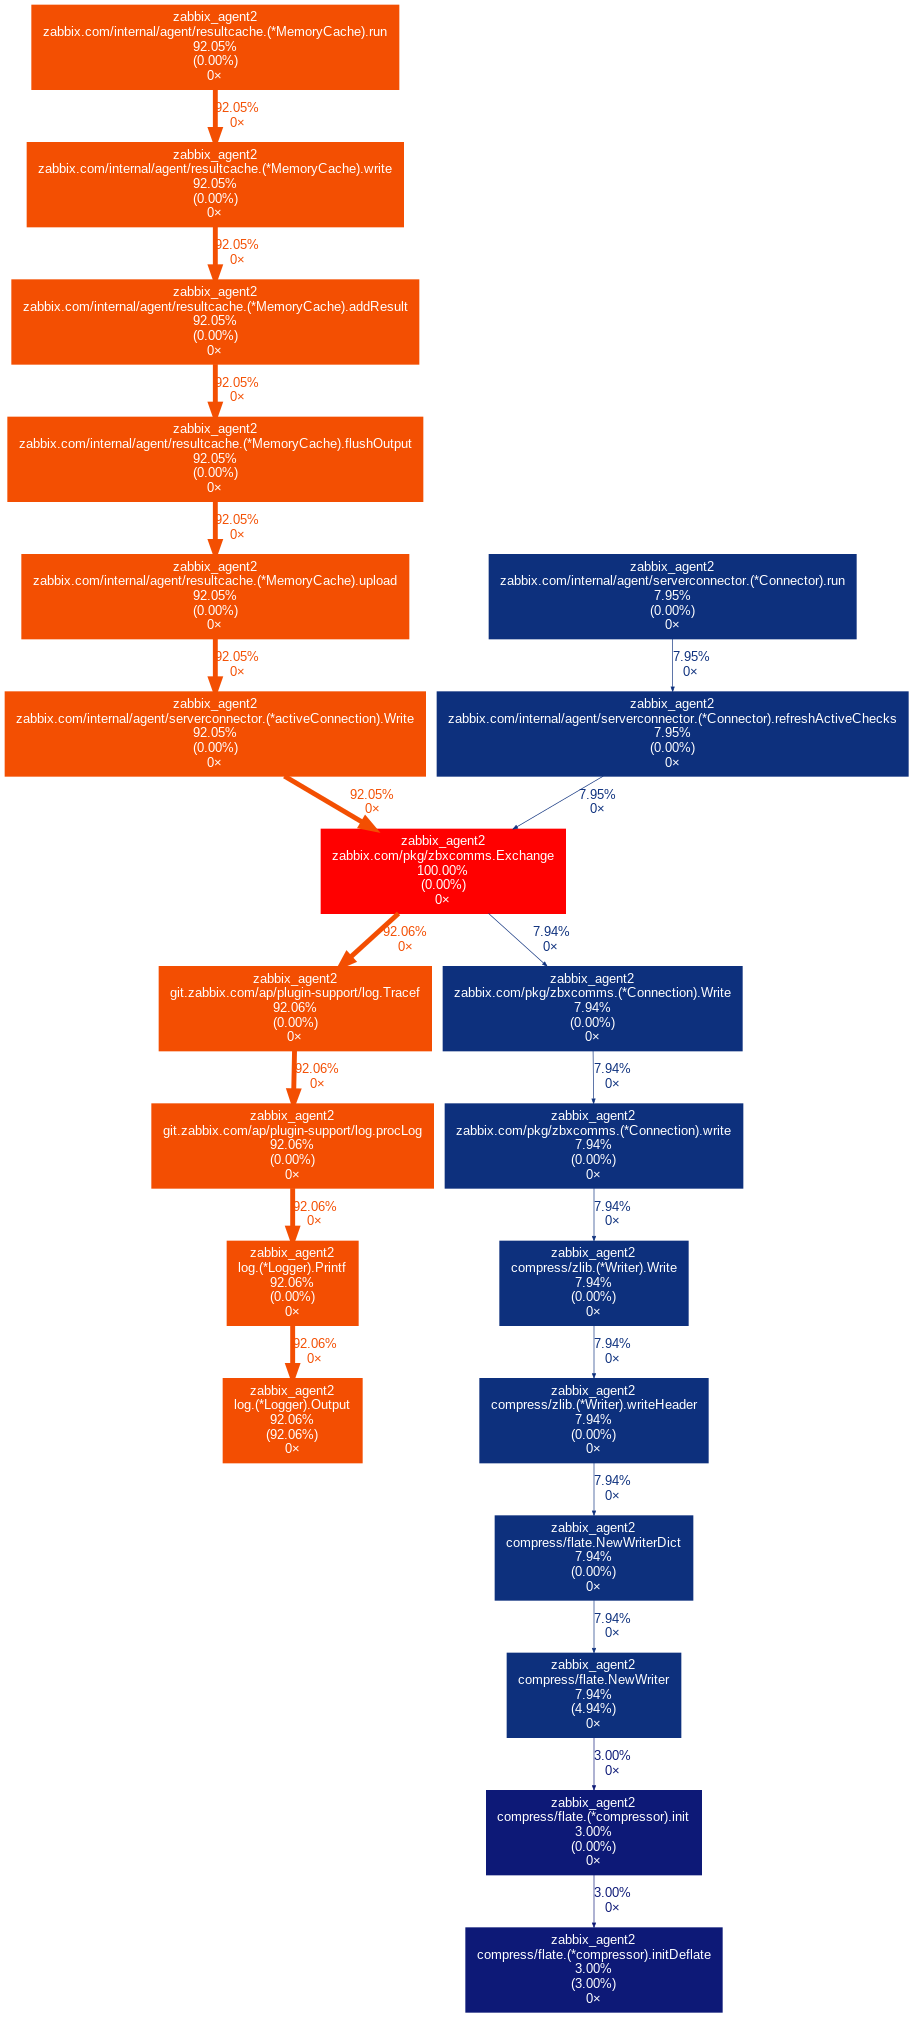
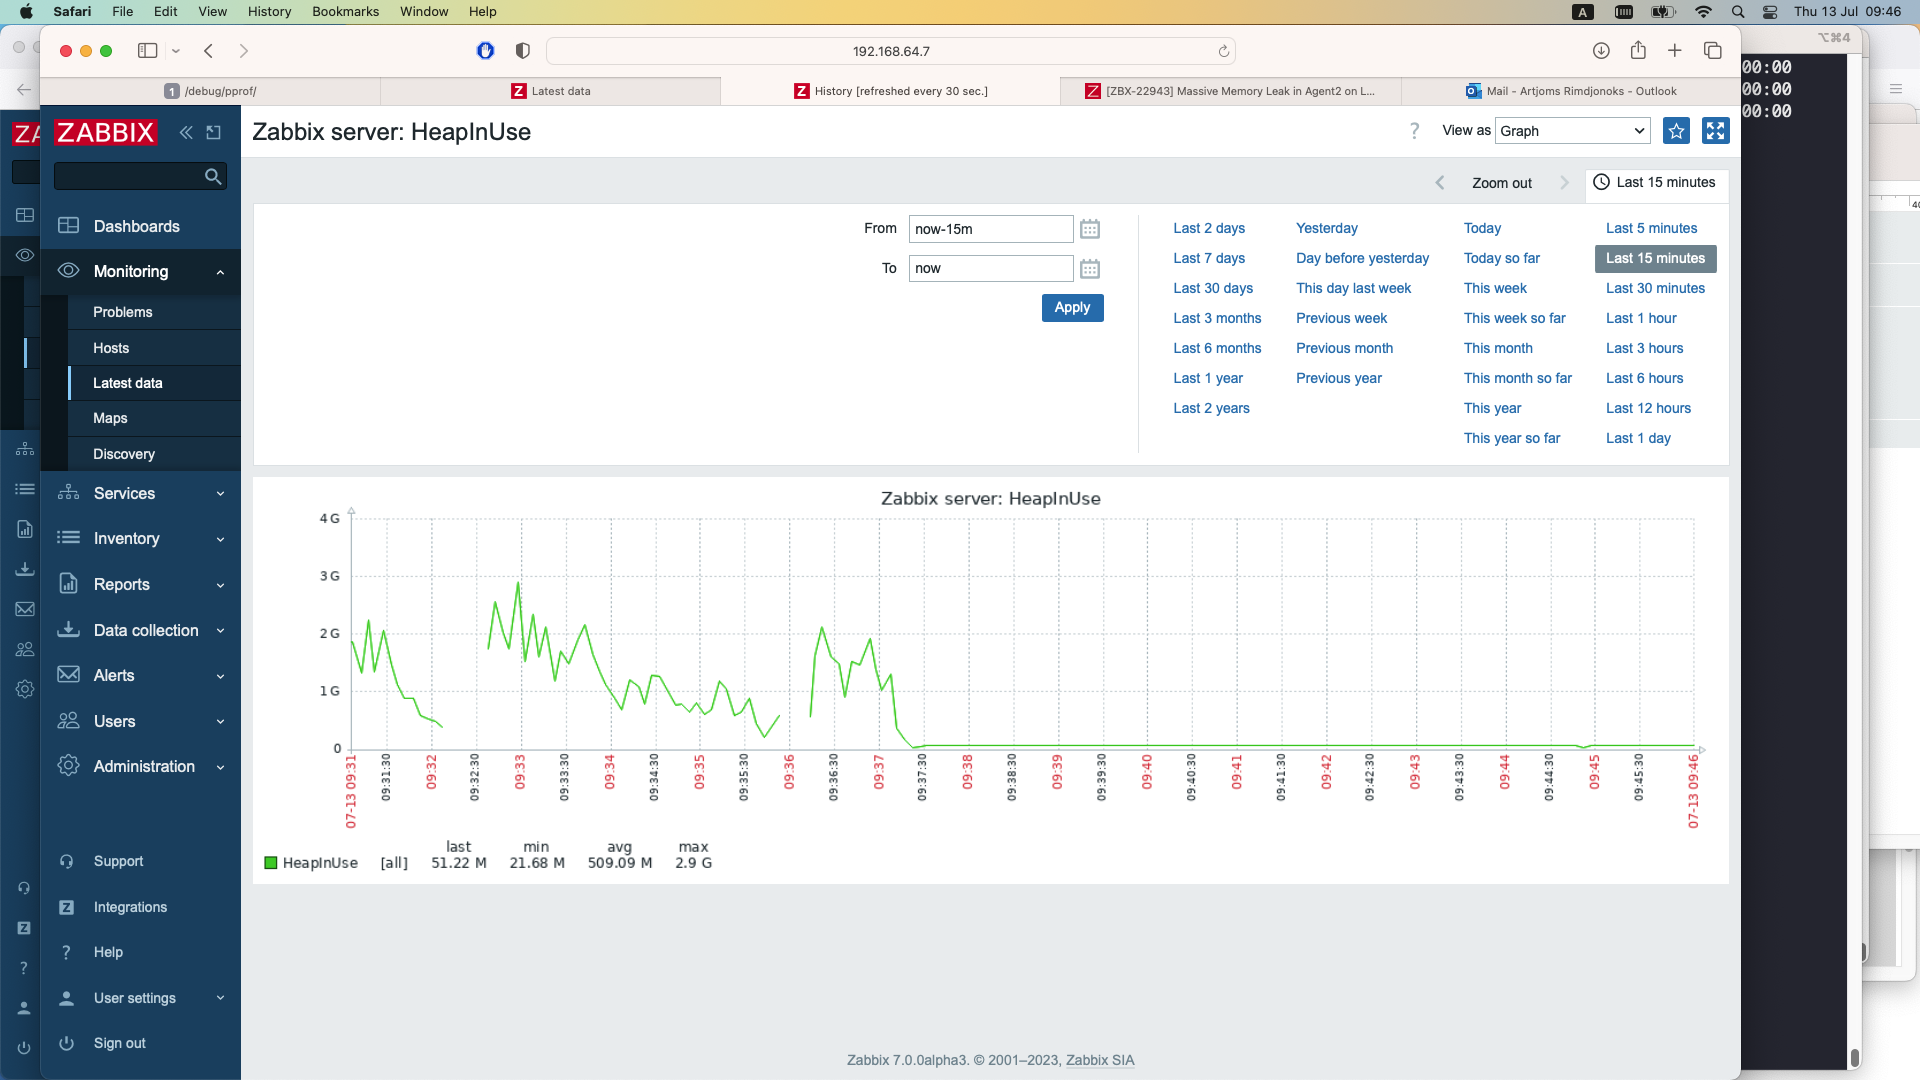
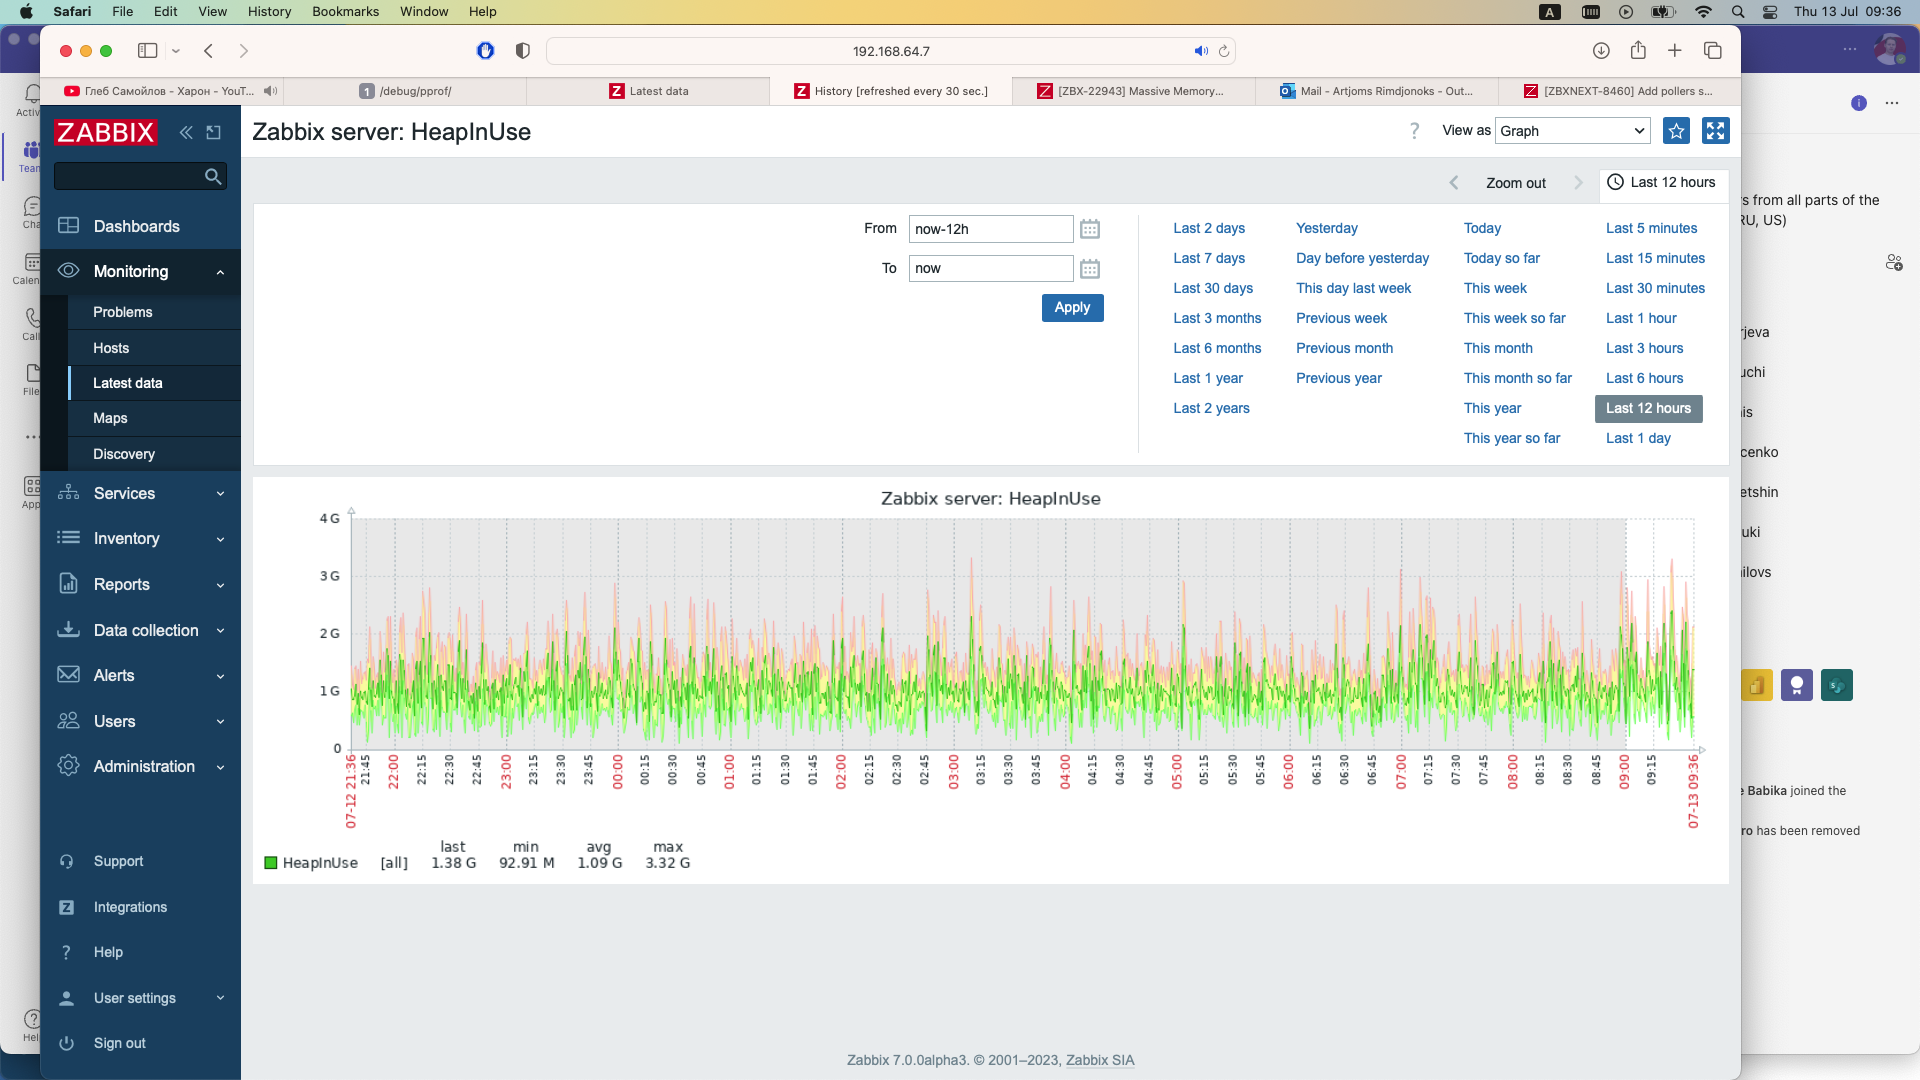
There seams to be a Memory Leak in Agent V2 version. How massive it is, will depend on how many logfiles and aggressivly are going to be monitored.
Currently we need to restart the Agent multple times a Day.
Tests already tried:
- Disable/Enable Agent encryption, no change
- BufferSize = 1, will slow the issue
- Work with PersistentBuffer, no change
- Increased Plugins.Log.MaxLinesPerSecond to 150,500,1000, no change
- reduced to one Logfile in Monitoring (it needs some time, but also increased slowly) ~1h
- memleax says:
CallStack[12]: may-leak=66 (4833 bytes)
 expired=66 (4833 bytes), free_expired=0 (0 bytes)
 alloc=452 (33265 bytes), free=275 (20277 bytes)
 freed memory live time: min=0 max=4 average=0
 un-freed memory live time: max=15
 0x00007f4c2e467740 libc-2.17.so malloc()+0
 0x0000000000bd52e7 zabbix_agent2 zbx_malloc2()+103
 0x0000000000aa0b43 zabbix_agent2 __zbx_zabbix_log()+245
 0x0000000000bf4039 zabbix_agent2 process_log_check()+12265
 0x0000000000aa17c9 zabbix_agent2 _cgo_c762f3fe2651_Cfunc_process_log_check()+160
 0x000000000048b304 zabbix_agent2
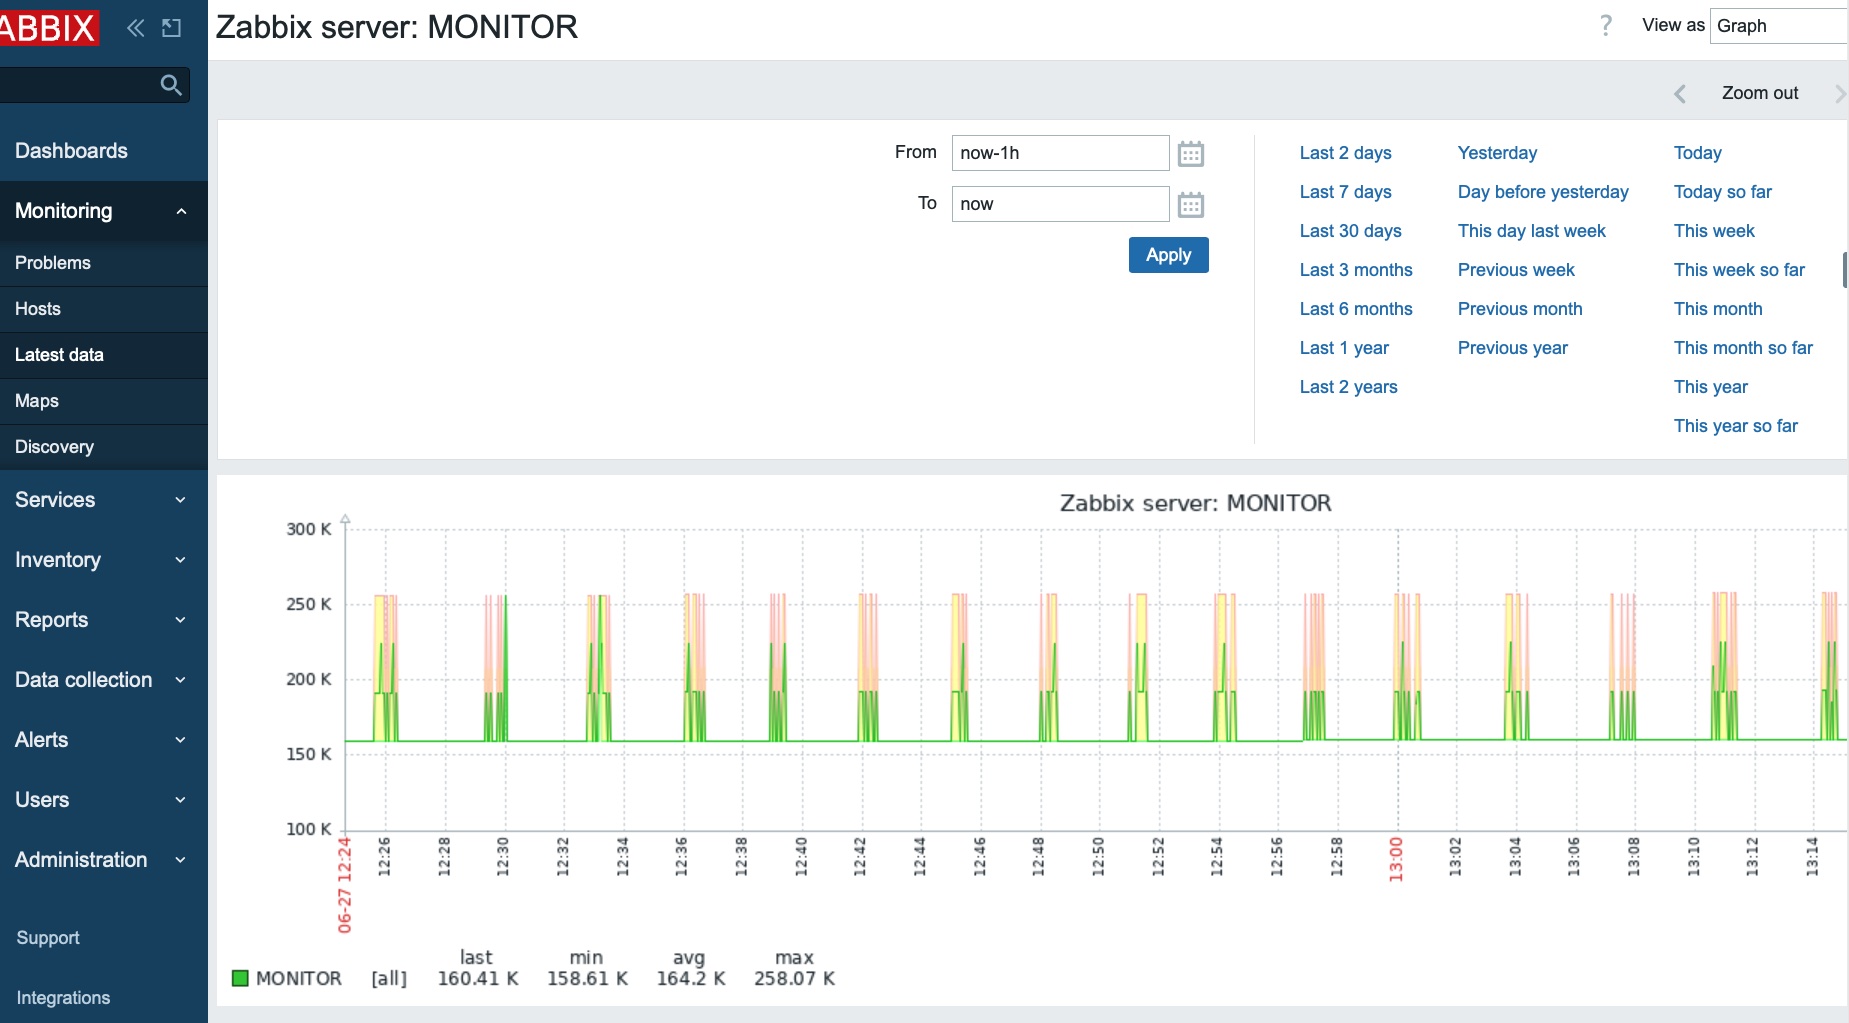
Measurement:
watch -n 1 "pmap -x $(pgrep zabbix_agent2) | tail;echo; ps -Tf -p $(pgrep zabbix_agent2) | wc -l"
Check the RSS and Dirty Value, both increases slow, but steadily. The usage is slightly wobbeling around +-2MB.
Refer to:
https://www.zabbix.com/forum/zabbix-help/465504-zabbix-agent-2-memory-leak-due-logfile-monitoring
https://discord.com/channels/713327720528085042/1116380766511837225{}
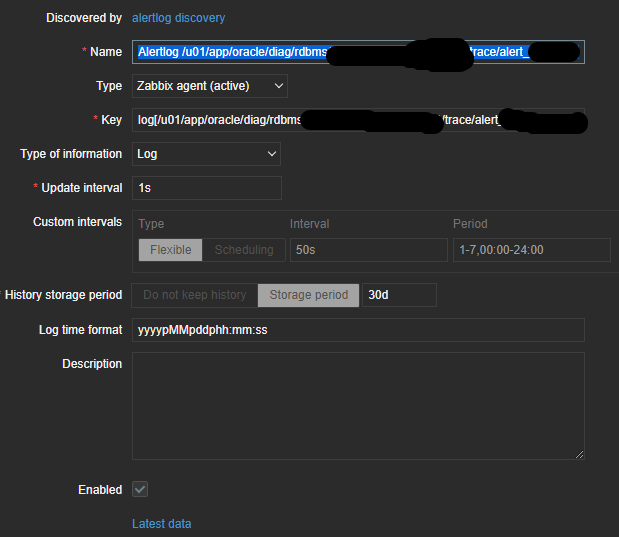
Steps to reproduce:
Enable Logfile Monitoring, wait some time ~5-15min
Result:
**
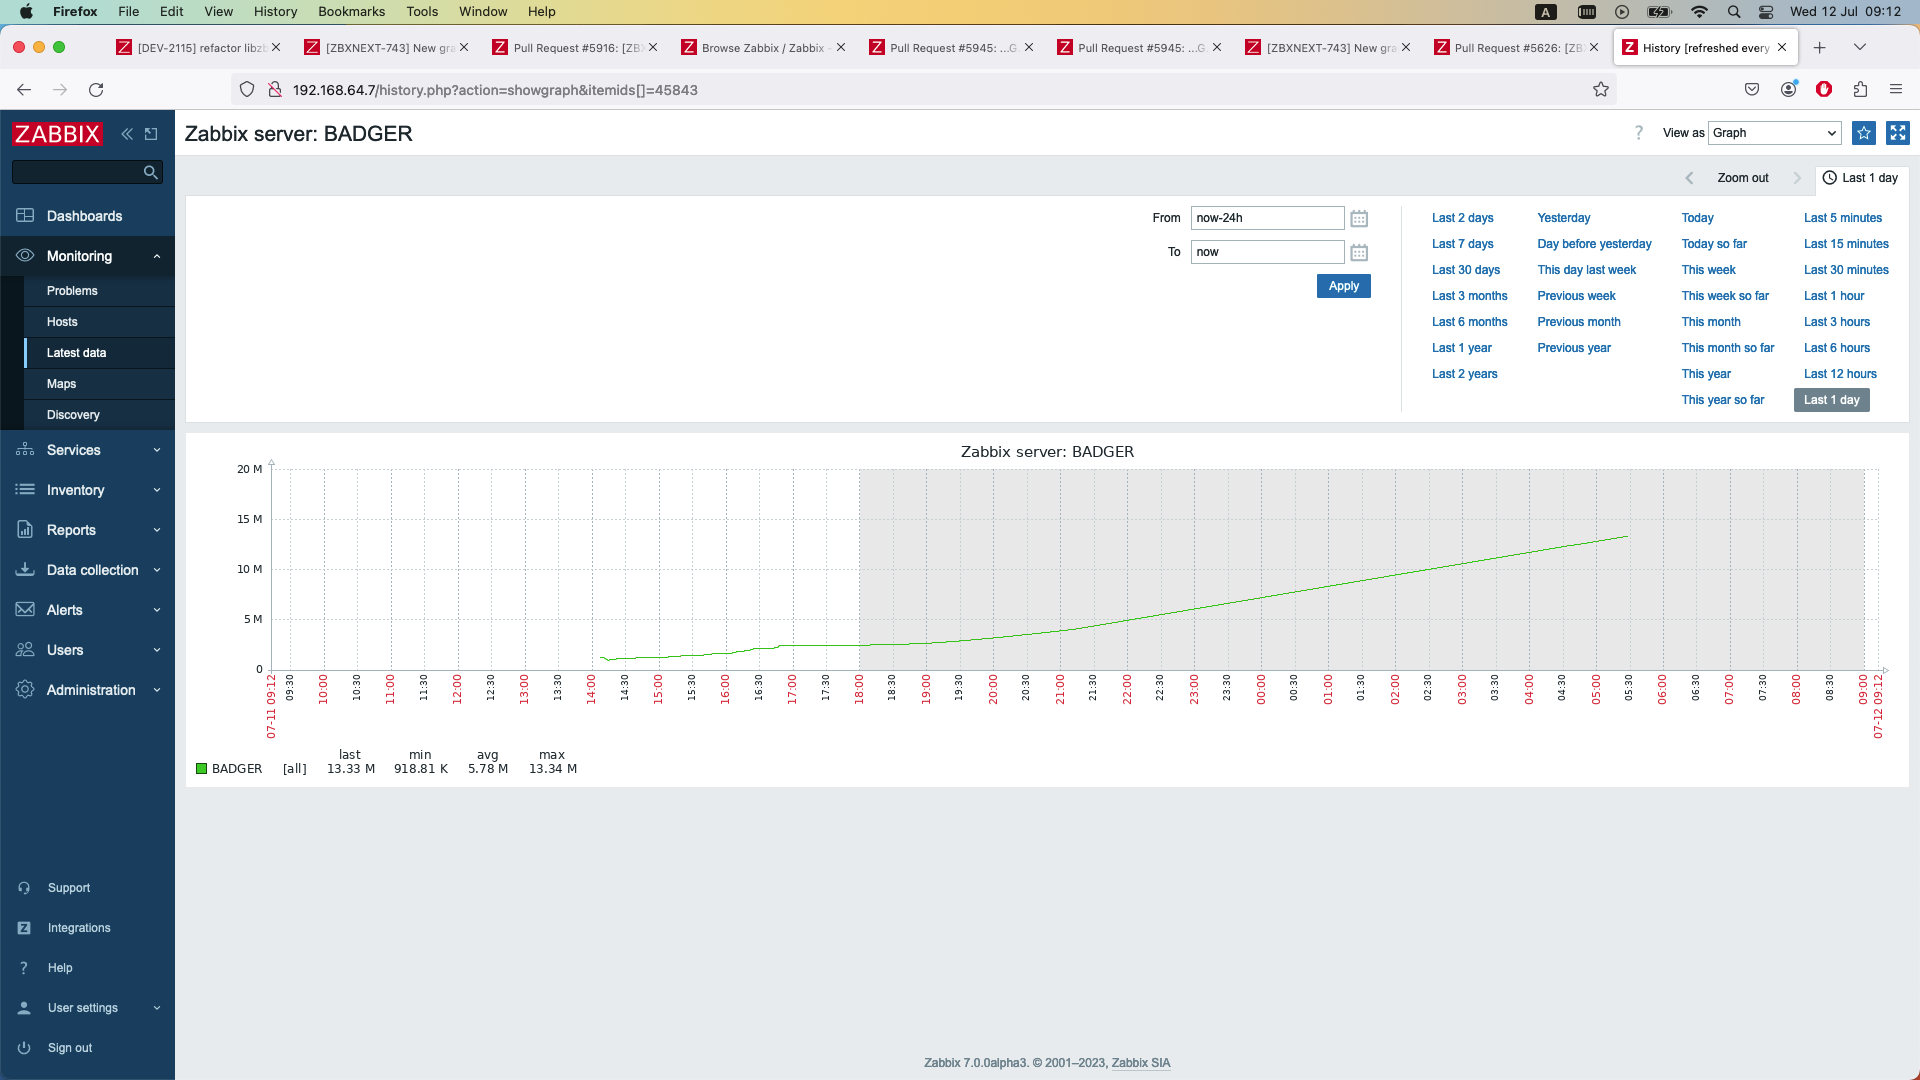
The Memory Usage RSS & Dirty according to pmap will report massive Memory Usage Values. Depending on how many Logfiles are monitored, ivh seen the following Memory Values:
- 24h ~ 500M-1,5G
- 14 Days ~ 15-20GB
Today tested (see Discord Link). Same Test under Agent V1 will not result in any Memory issue.
Expected:
A stable Memory Usage, Less than multiple 100MB.
Current Workaround:
Switch to agent v1