Add additional units to the graph Y axis

XMLWordPrintable

    • Type: Incident report
    • Resolution: Fixed
    • Priority: Major
    • None
    • Affects Version/s: 1.8.2
    • Component/s: Frontend (F)
    • None

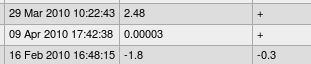
      It is displayed that y axis in the graph is 0.000 when the acquisition value of data is very small, and doesn't understand the numerical value.
      In this case, additional units (m,?) would be helpful.

            Assignee:
            Unassigned
            Reporter:
            Artem Suharev (Inactive)
            Votes:
            0 Vote for this issue
            Watchers:
            1 Start watching this issue

              Created:
              Updated:
              Resolved: