-
Type:
Problem report
-
Resolution: Fixed
-
Priority:
 Trivial
-
Affects Version/s: None
-
Component/s: Server (S)
-
None
-
Environment:DB: (PostgreSQL) 14.5 (Ubuntu 14.5-2.pgdg20.04+2) + timescaledb 2.7.1
40 CPU, 110 GB RAM
Server: HA Zabbix two nodes cluster - 6.4.0 8 CPU, 94 GB RAM, zabbix-server 6.4.0
Number of hosts (enabled) - 28072
Number of items (enabled/disabled/not supported) - 16252550 / 30882 / 118504
Number of triggers (enabled/disabled) - 3500298 / 35441
Required server performance, new values per second - 30584.64
Everything is monitored by 14 active zabbix proxies.
95% of items have logrt.count keyDB: (PostgreSQL) 14.5 (Ubuntu 14.5-2.pgdg20.04+2) + timescaledb 2.7.1 40 CPU, 110 GB RAM Server: HA Zabbix two nodes cluster - 6.4.0 8 CPU, 94 GB RAM, zabbix-server 6.4.0 Number of hosts (enabled) - 28072 Number of items (enabled/disabled/not supported) - 16252550 / 30882 / 118504 Number of triggers (enabled/disabled) - 3500298 / 35441 Required server performance, new values per second - 30584.64 Everything is monitored by 14 active zabbix proxies. 95% of items have logrt.count key
-
Sprint 104 (Sep 2023), Sprint 105 (Oct 2023)
-
0.5
Steps to reproduce:
When we have to switch node from zabbix01 to zabbix02, we are doing restart or stop server on active node:
systemctl restart (or stop) zabbix-server
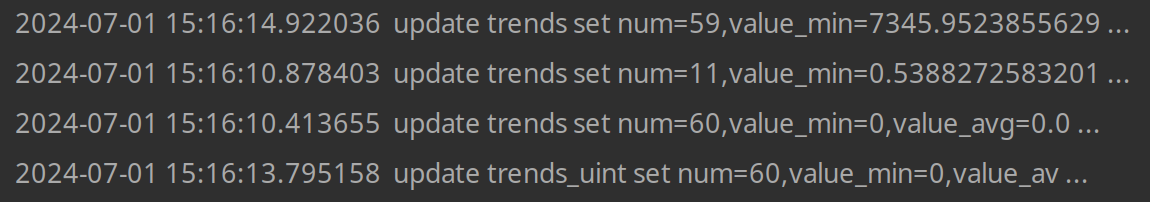
After that We had a lot of logs something like:
1069915:20230705:094022.360 syncing trend data...
1069915:20230705:094351.568 slow query: 202.510611 sec, "select distinct itemid from trends where clock>=1688540400 and (itemid in (1000xITEMID))"
1069915:20230705:095751.112 slow query: 785.832866 sec, "select distinct itemid from trends_uint where clock>=1688540400 and (itemid in (1000xITEMID))"
1069915:20230705:100035.095 slow query: 41.348138 sec, "select distinct itemid from trends_uint where clock>=1688540400 and (itemid in (1000xITEMID))"
full queries from restart in attachment.
We didn't have any other logs, especially - no more slow queries ("INSERT INTO trends" was running less that 1-2s)
Result:
After 30 minutes We had to kill zabbix-server process (we know this is not recommend, but we cannot afford such a long downtime)
From another restart we checked this SELECT (shortened for readability):
496064:20230705:113740.118 slow query: 237.515113 sec, "select distinct itemid from trends where clock>=1688547600 and (itemid in (1000xITEMID))"
Timestamp: 1688547600 -> 11:00:00 (GMT +2)
So we check the same SELECT on database (we know we have to check this before 12:00:00 [GMT +2]):
EXPLAIN ANALIYZE select distinct itemid from trends where clock>=1688547600 and (itemid in (1000xITEMID));
Execution time: 11:38:00 (GMT +2):
 Unique  (cost=2.95..2.95 rows=1 width=8) (actual time=28570.089..28570.096 rows=0 loops=1)
   ->  Custom Scan (SkipScan) on _hyper_6_1328_chunk  (cost=2.95..2.95 rows=1 width=8) (actual time=28570.088..28570.094 rows=0 loops=1)
         ->  Index Only Scan using "1328_989_trends_pkey" on _hyper_6_1328_chunk  (cost=2.95..4737681.97 rows=1 width=8) (actual time=28570.063..28570.082 rows=0 loops=1)
               Index Cond: ((itemid > NULL::bigint) AND (clock >= 1688547600))
               Filter: ((itemid = ANY ('{1000xITEMID}'::bigint[])))
               Heap Fetches: 197123
 Planning Time: 4.849 ms
 Execution Time: 28570.172 ms
(8 rows)
Execution time: 11:52:00 (GMT +2):
 Unique  (cost=2.95..2.95 rows=1 width=8) (actual time=38709.553..38709.556 rows=0 loops=1)
   ->  Custom Scan (SkipScan) on _hyper_6_1328_chunk  (cost=2.95..2.95 rows=1 width=8) (actual time=38709.551..38709.554 rows=0 loops=1)
         ->  Index Only Scan using "1328_989_trends_pkey" on _hyper_6_1328_chunk  (cost=2.95..4737681.97 rows=1 width=8) (actual time=38709.462..38709.547 rows=0 loops=1)
               Index Cond: ((itemid > NULL::bigint) AND (clock >= 1688547600))
               Filter: ((itemid = ANY ('{1000xITEMID}'::bigint[])))
               Heap Fetches: 197123
 Planning Time: 14.917 ms
 Execution Time: 38709.745 ms
(8 rows)
We know that someting must be cached, but still - it takes quite a long time. Longer than expected.
Expected:
Maybe some query optimization or some change in the "trends" table structure so that this query could run faster.
- depends on
-
-

- Closed
-
- is duplicated by
-
-
- Closed
-
-
-

- Closed
-
- part of
-
-
- Closed
-
- mentioned in
-
Page Loading...
