-
Type:
Problem report
-
Resolution: Unresolved
-
Priority:
 Trivial
-
None
-
Affects Version/s: 6.4.4
-
Component/s: None
-
None
With the new client-rendered graphs, if one selects "missing data:Last known", then only points between samples are plotted, which is the same behaviour as in "connected". This is important for low-sampled data (e.g. daily).
There are 2 subcases:
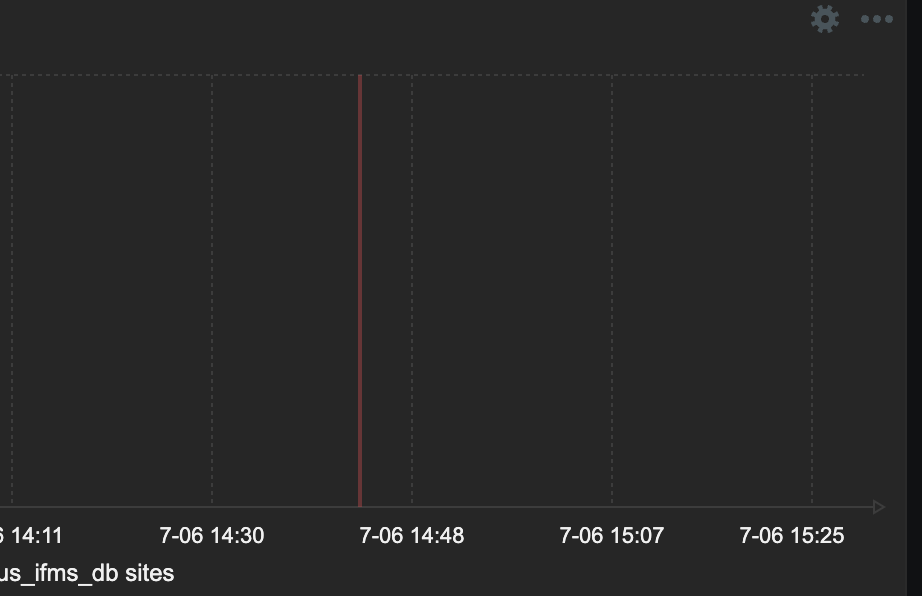
Case 1: Last sample is not in zoom range (e.g. zoom is 6h, last sample is 8h old): no plot is displayed, and no tooltip is shown (fig 1):

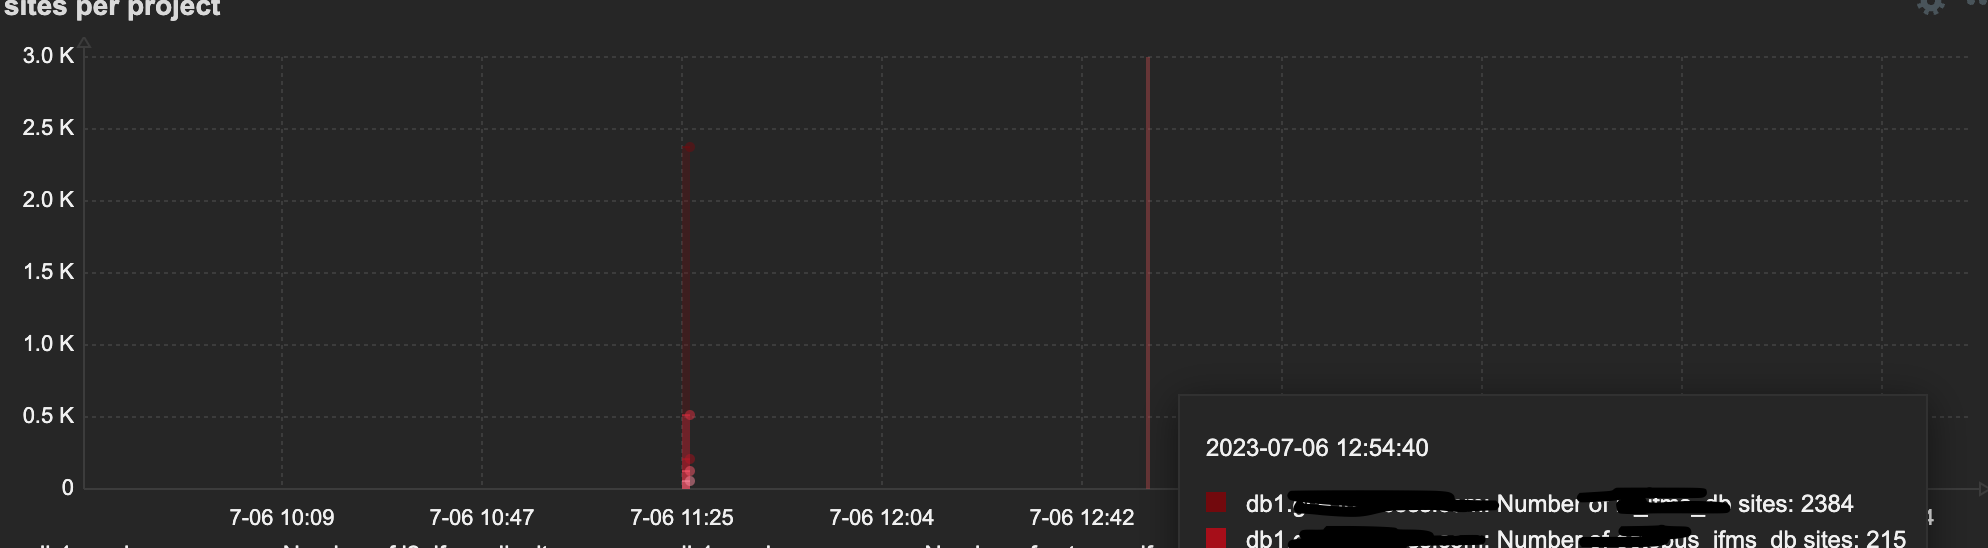
Case 2: Last one sample is in zoom range. No plot, only points at the sample time are shown; tooltip at the right of points shows values, at the left of points shows no values.
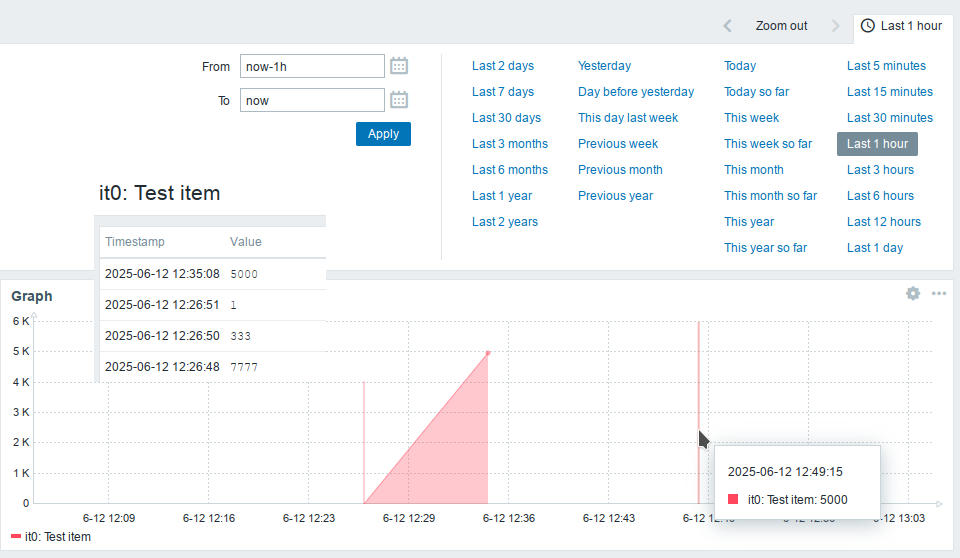
Expected behaviour: data to be plotted at least from sample time until the end of zoom period (missing data). (Fig 2):