-
Type:
Problem report
-
Resolution: Won't fix
-
Priority:
 Trivial
-
None
-
Affects Version/s: 6.0.20
-
Component/s: Frontend (F)
-
None
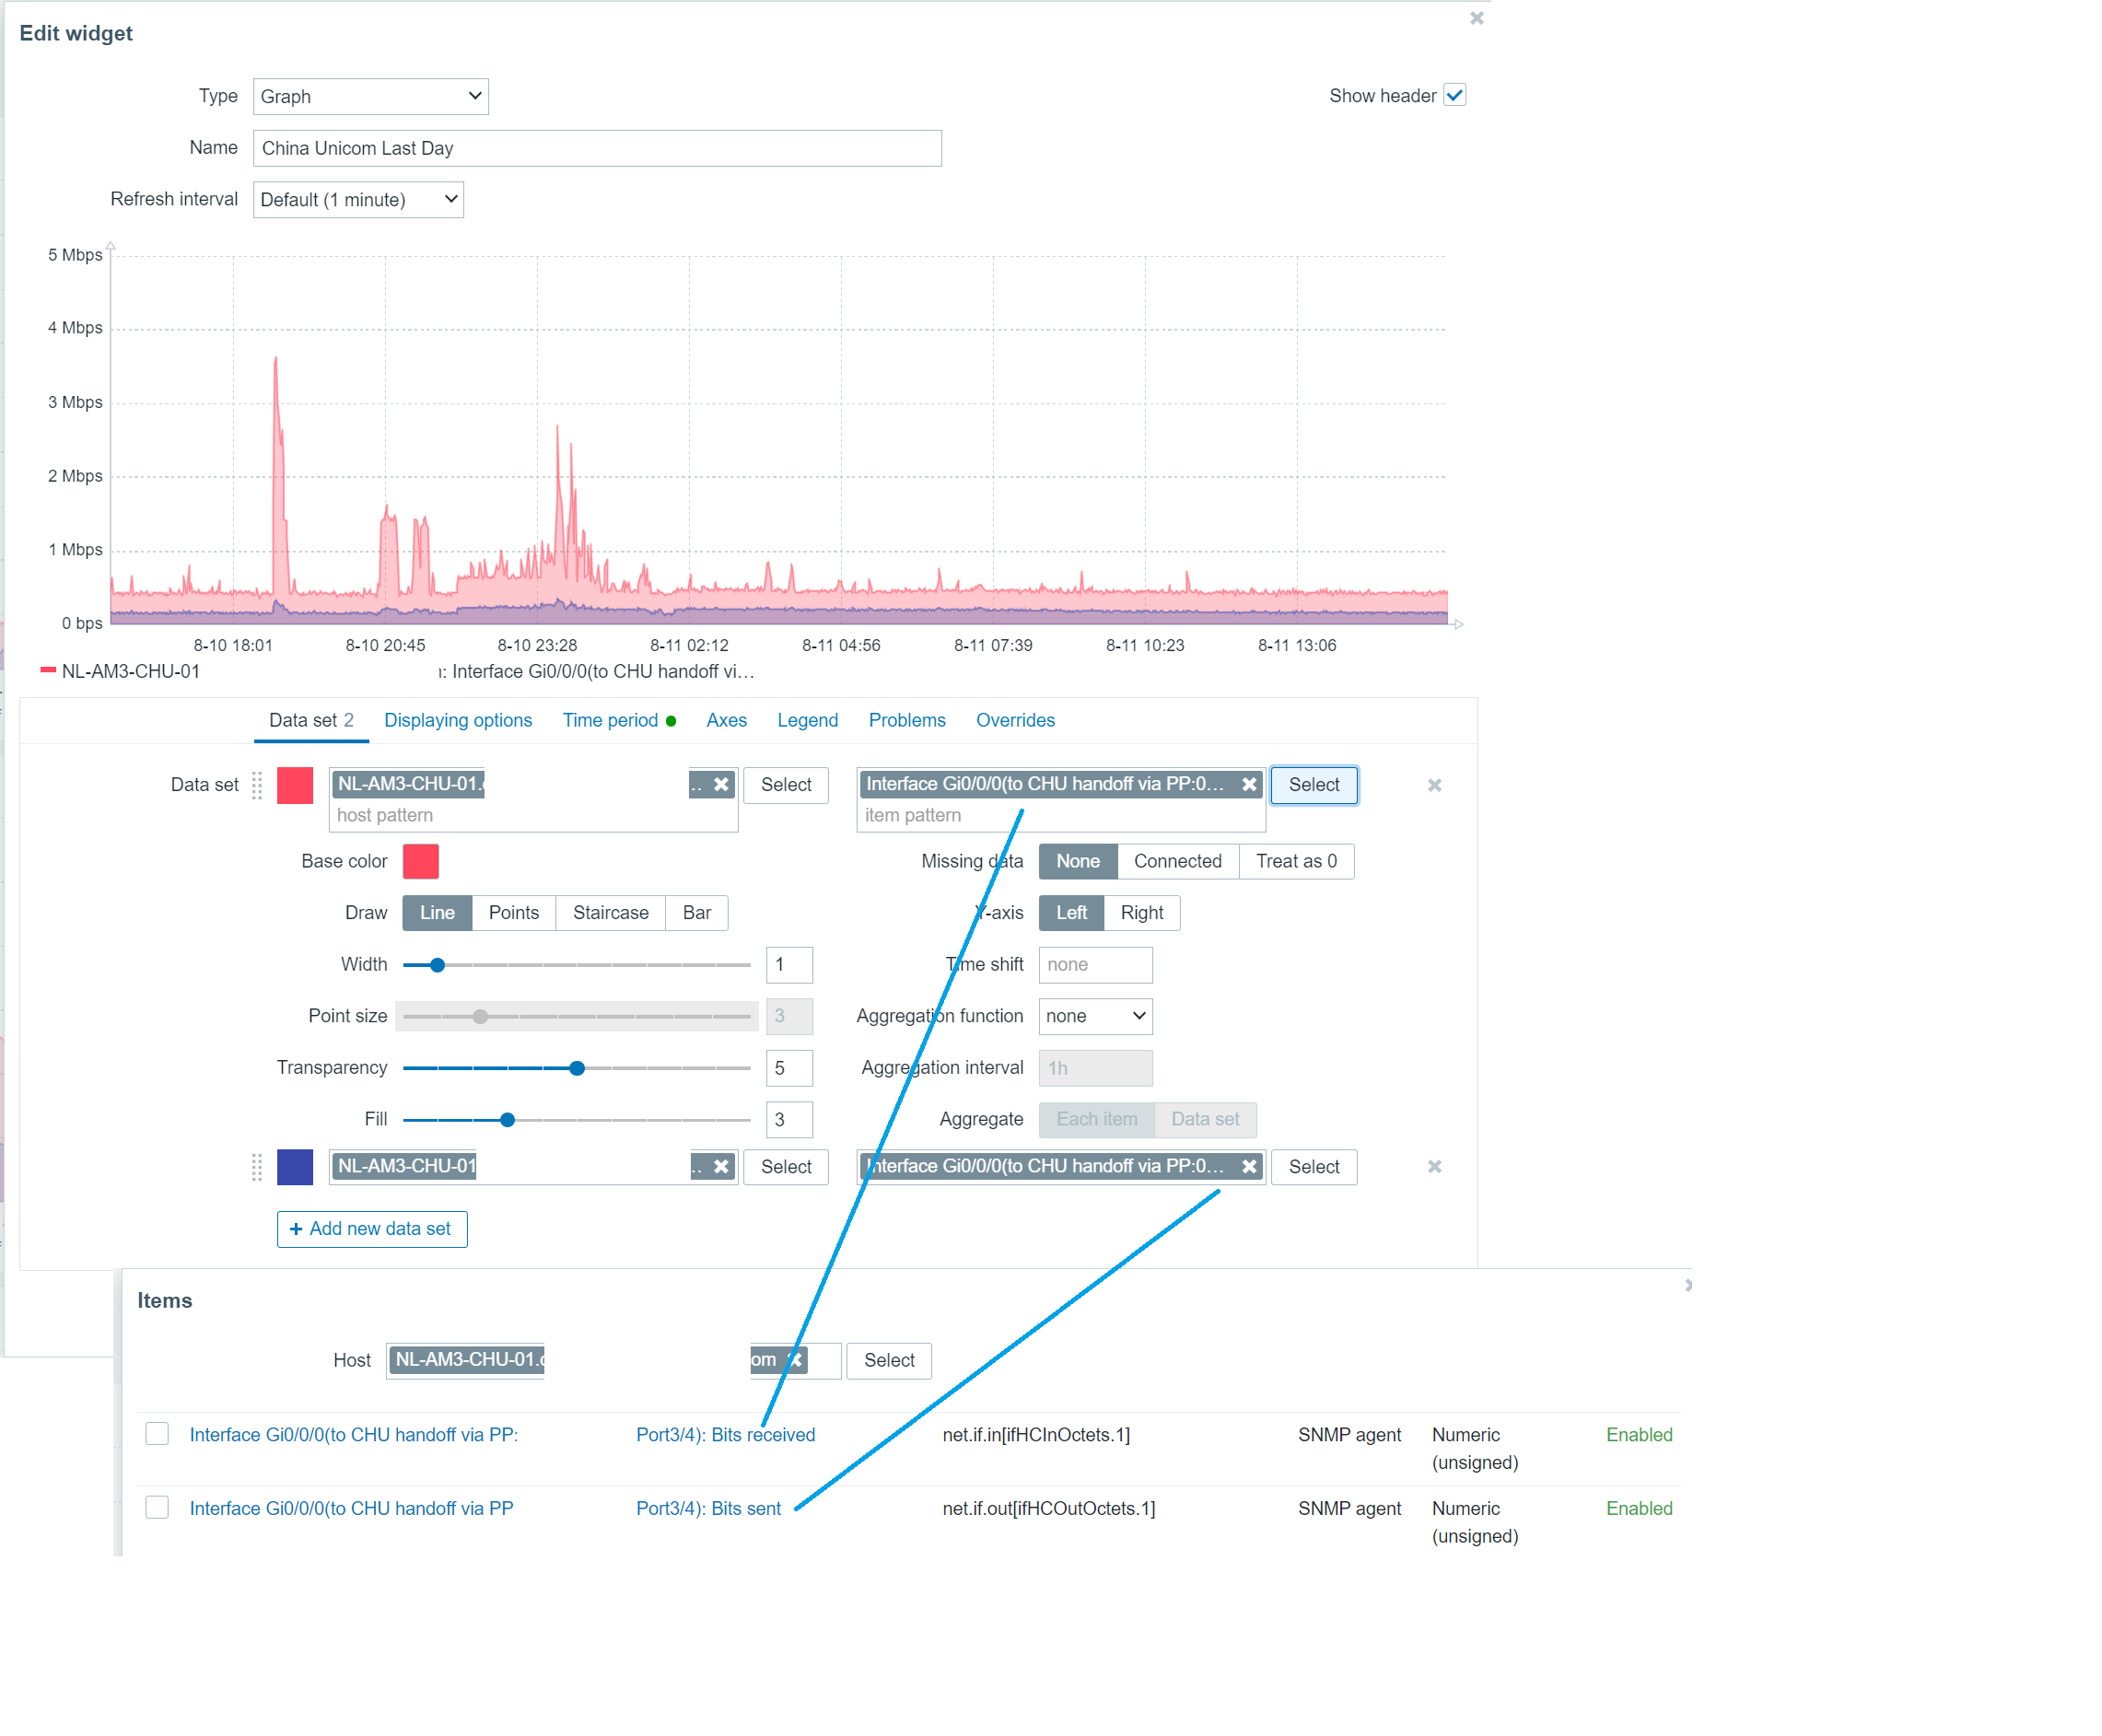
I have one dashboard with 3 graph widgets each for a interface TX/RX bits for last 1day, last 7 days, last 30days.
Each graph widget has 2 data sets with item pattern
Interface Gi0/0/0(to ISP handoff): Bits received net.if.in[ifHCInOctets.1] SNMP agent Numeric (unsigned) Enabled
Interface Gi0/0/0(to ISP handoff): Bits sent net.if.out[ifHCOutOctets.1] SNMP agent Numeric (unsigned) Enabled
Then I updated the interface description string in Cisco router config to include the patch panel port detail. The dashboard is empty after this change.
The data sets' "item pattern" still point to Interface Gi0/0/0(to ISP handoff), but when I select item pattern again, I can see the available item patterns are
Interface Gi0/0/0(to ISP handoff via Patch Panel XXX): Bits received net.if.in[ifHCInOctets.1] SNMP agent Numeric (unsigned) Enabled
Interface Gi0/0/0(to ISP handoff via Patch Panel XXX): Bits sent net.if.out[ifHCOutOctets.1] SNMP agent Numeric (unsigned) Enabled
I can only fix the dashbord be specifying the new "item pattern" or by rollback the interface description. The graph is always good in Monitoring/Hosts/xxx Router/Graphs regardless of the description change. I think the dashboard get the value by checking "Interface Gi0/0/0(to ISP handoff via Patch Panel XXX)" instead of checking permanent "net.if.in[ifHCInOctets.1]" and "net.if.out[ifHCOutOctets.1]"
I have to fix the dashboard again each time the interface description string gets changed in Cisco router config?
Steps to reproduce:
- Changes in configuration...
- Navigate to screen title...
- Click on screen element...
- ...
Result:
See screenshot...
See log file...
See memory dump...
Expected:
See screenshot....
See attached patch file...