-
Type:
Problem report
-
Resolution: Commercial support required
-
Priority:
 Trivial
-
None
-
Affects Version/s: 6.0.20
-
Component/s: None
-
None
-
Environment:We have a single zabbix server installation, with two proxies. The server is running on a VM (vmware) using a PGSQL with timescaleDB on a different system. The db is around 650G. The system is managing 2700 hosts, 144k items, 81k triggers.
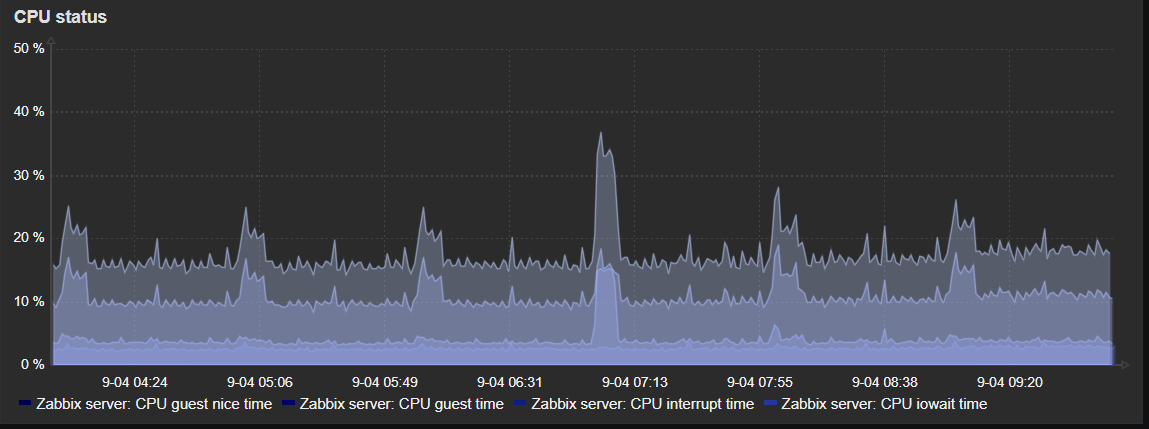
The system is low on CPU and has more that 50% availiable memory.
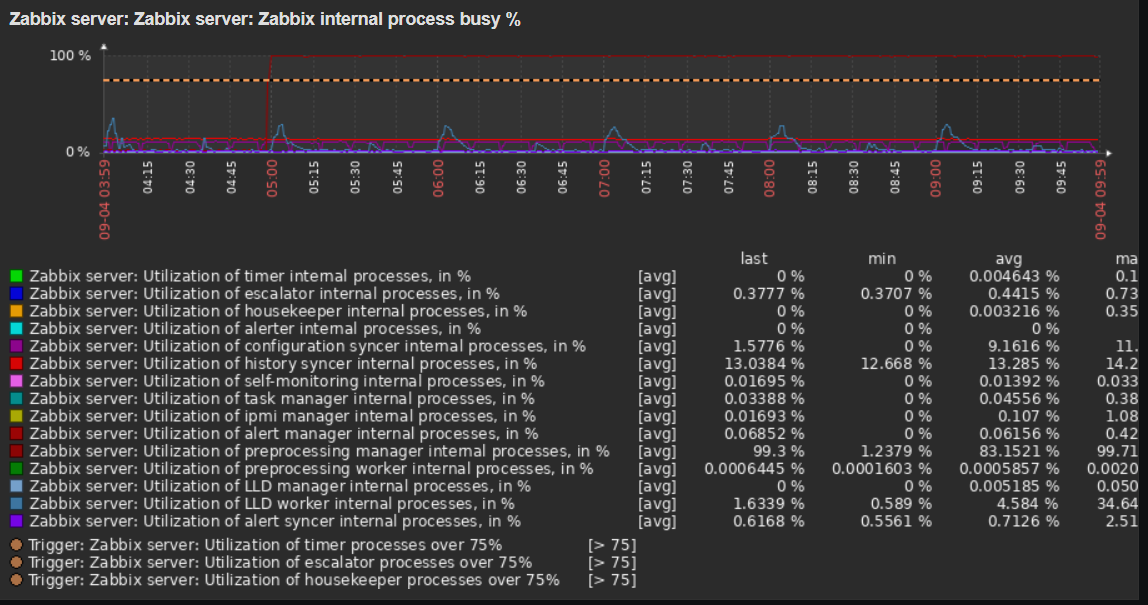
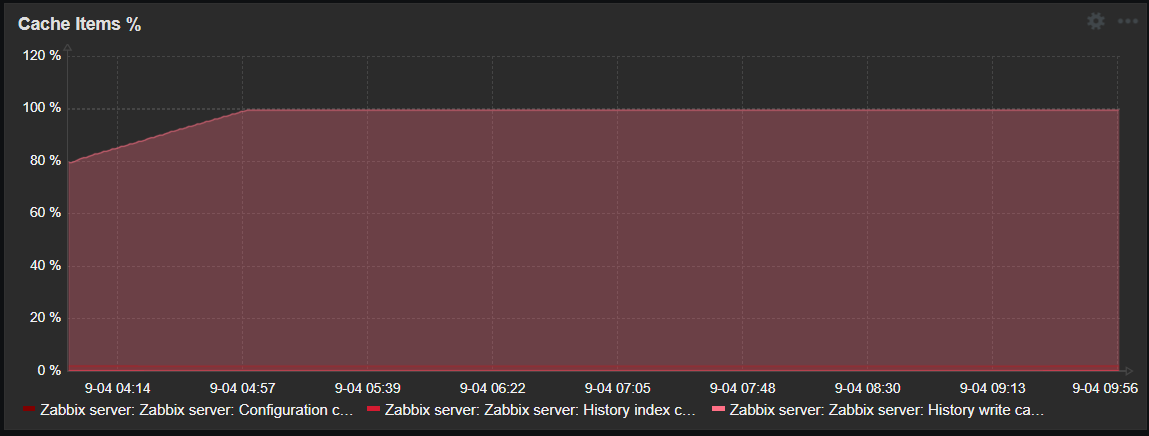
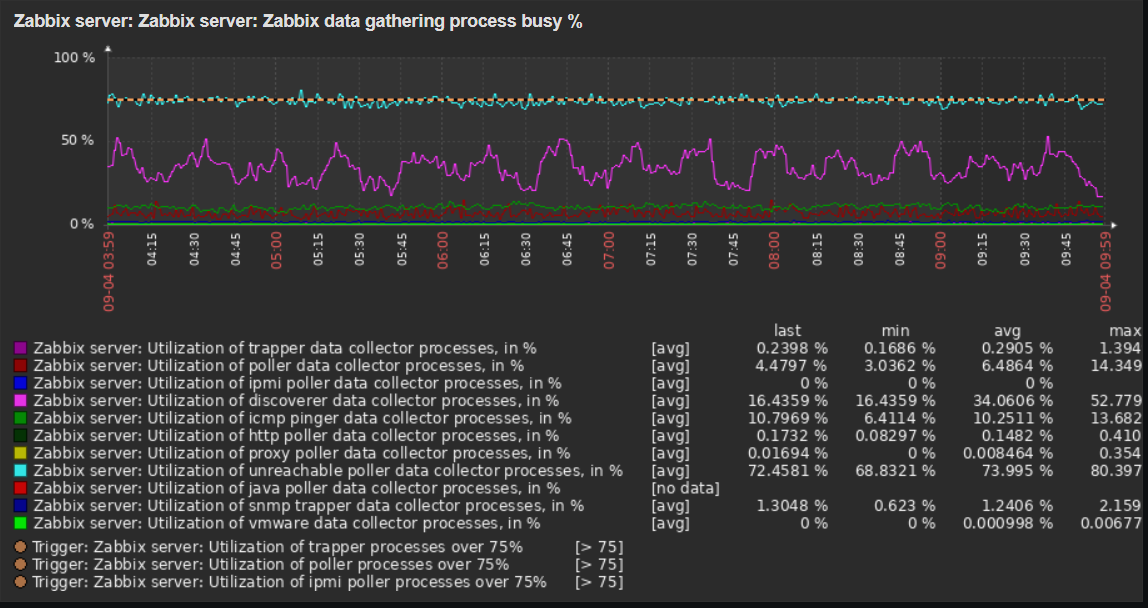
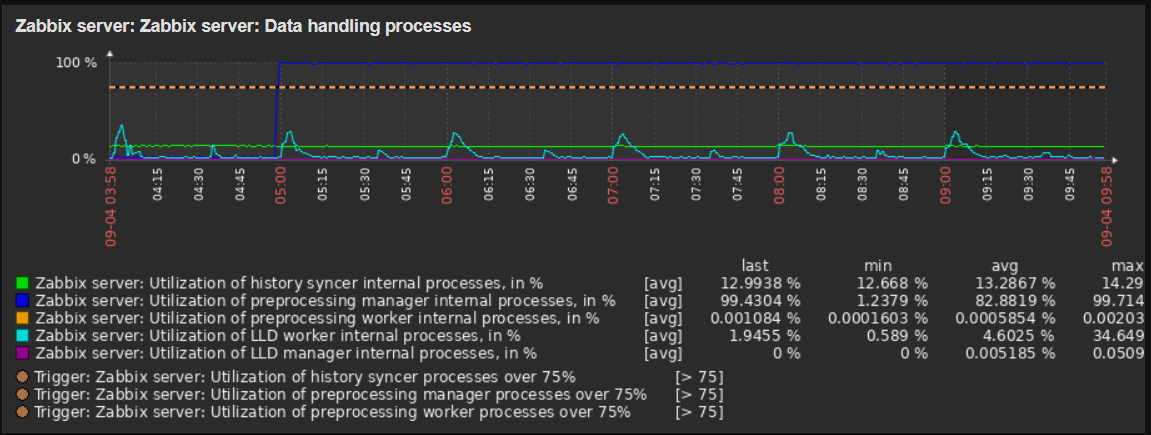
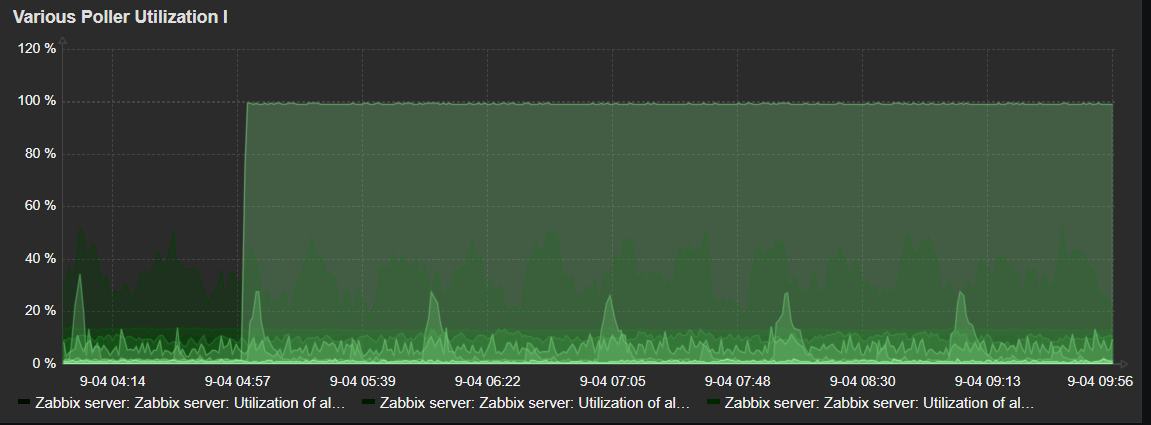
The problem is that when we start the server, it takes about 3 hours to reach 100% History write cache and after that the poller utilization goes to 100%.
After that the system is not updating any graphs.
The PGSQL db has low CPU and mem usage, we did not found anything out of the ordinary. The disk file system sits on an NMVE enterprise disk array.
When we stop the zabbix server it takes roughly 6 hours to stop the process as it needs to write data to the DB.
We need to find out what is wrng with the setup.