-
Type:
Problem report
-
Resolution: Incomplete
-
Priority:
 Trivial
-
None
-
Affects Version/s: 6.0.20
-
Component/s: Frontend (F)
-
None
-
Environment:Windows
Dear Sir/Madam,
I am using Zabbix monitoring tool 6.0.
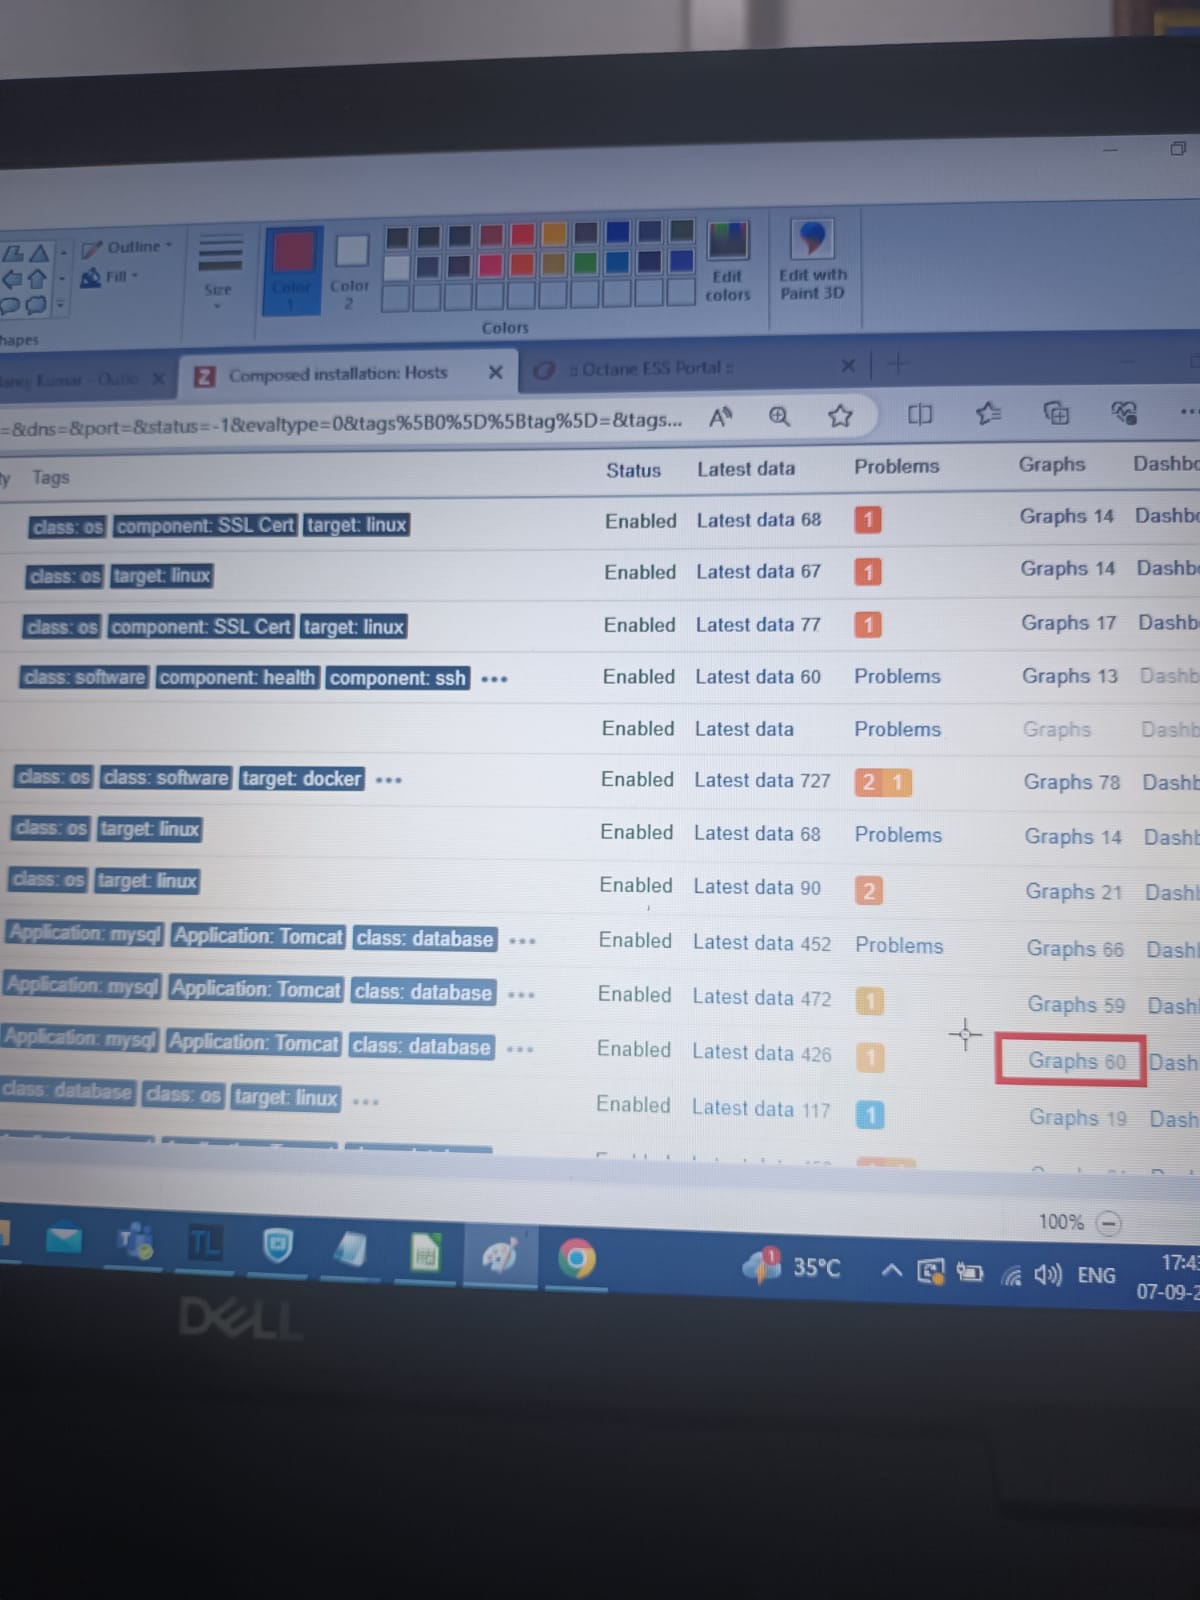
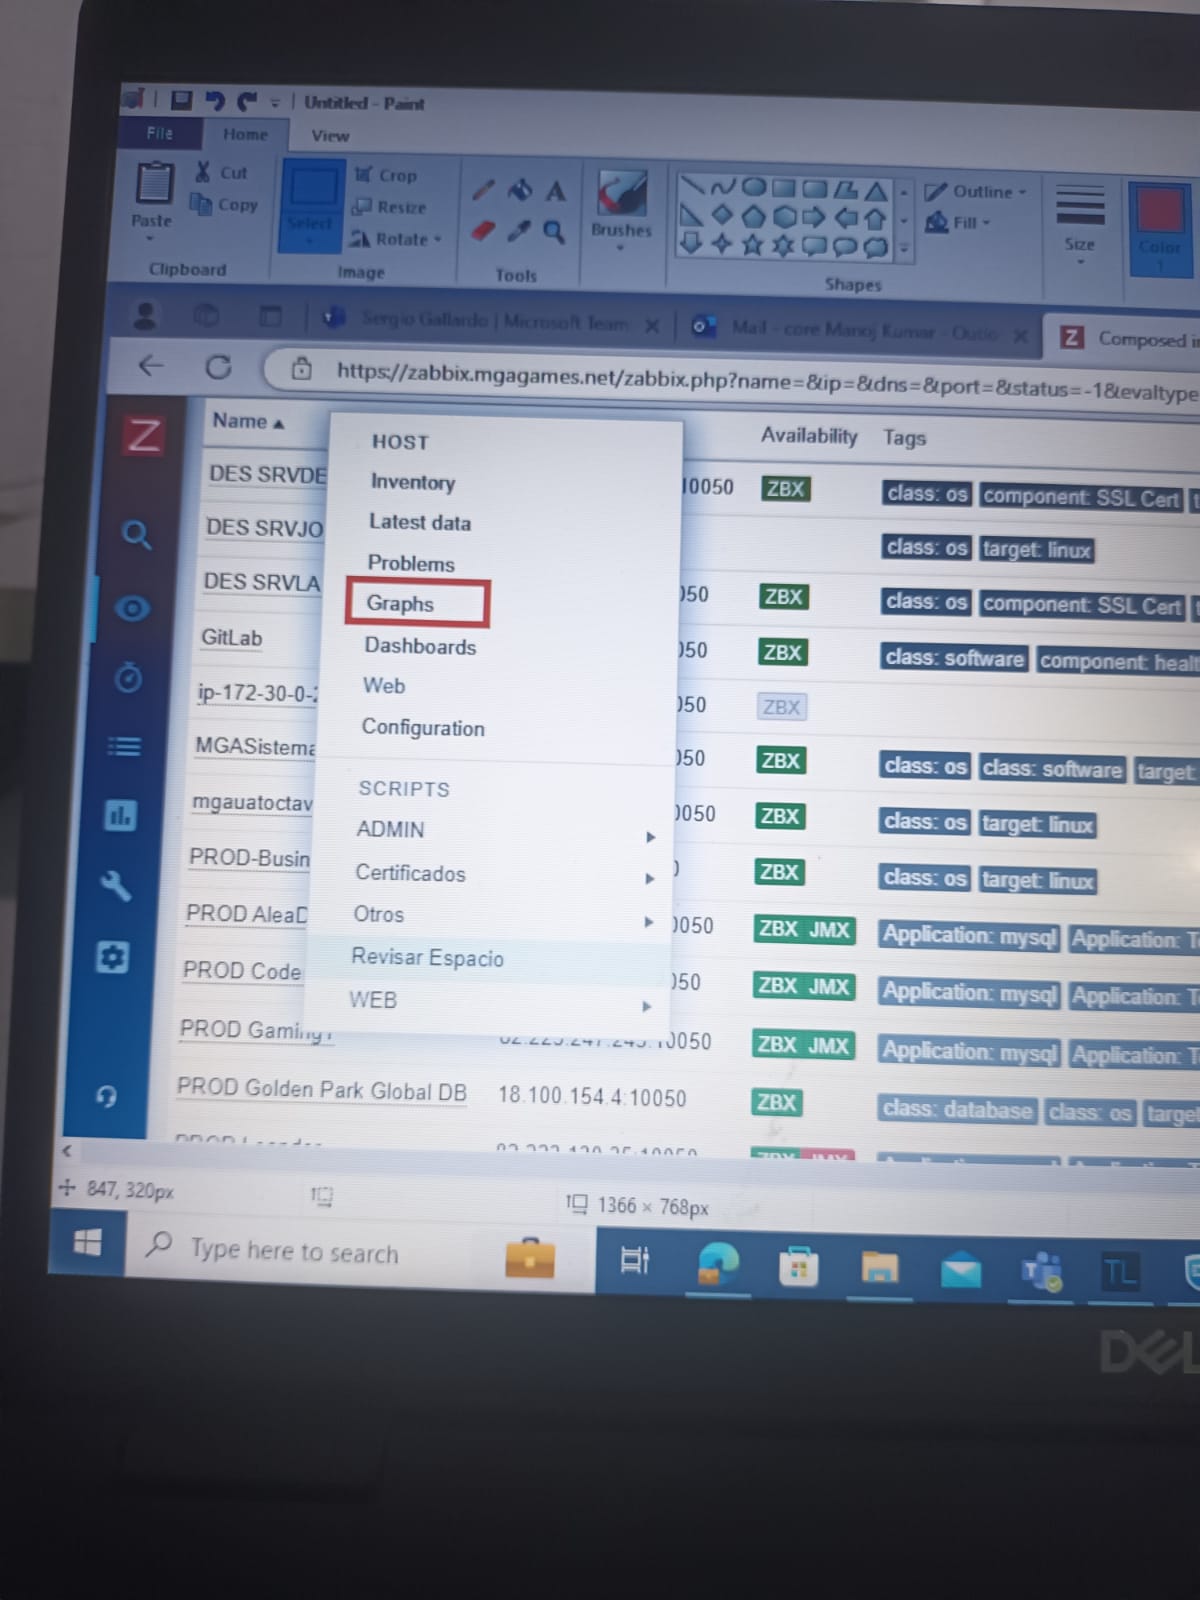
I can display graphs using two options:


Option1 display graphs, what we created in tamplate.
Option2 display all graphs, what created and a graph for each item.
It seams that the option2 is not correct.
Could any one explain about this ?
Regards
Manoj