-
Type:
Incident report
-
Resolution: Commercial support required
-
Priority:
 Trivial
-
None
-
Affects Version/s: 6.4.6
-
Component/s: Server (S)
-
None
-
Environment:Ubuntu 20.04.6 (x86)
zabbix-server-pgsql 1:6.4.6-1+ubuntu20.04
postgresql-15 15.4-2.pgdg20.04+1
timescaledb-2-postgresql-15 2.11.2~ubuntu20.04
Steps to reproduce:
- No steps known to reproduce
Result:
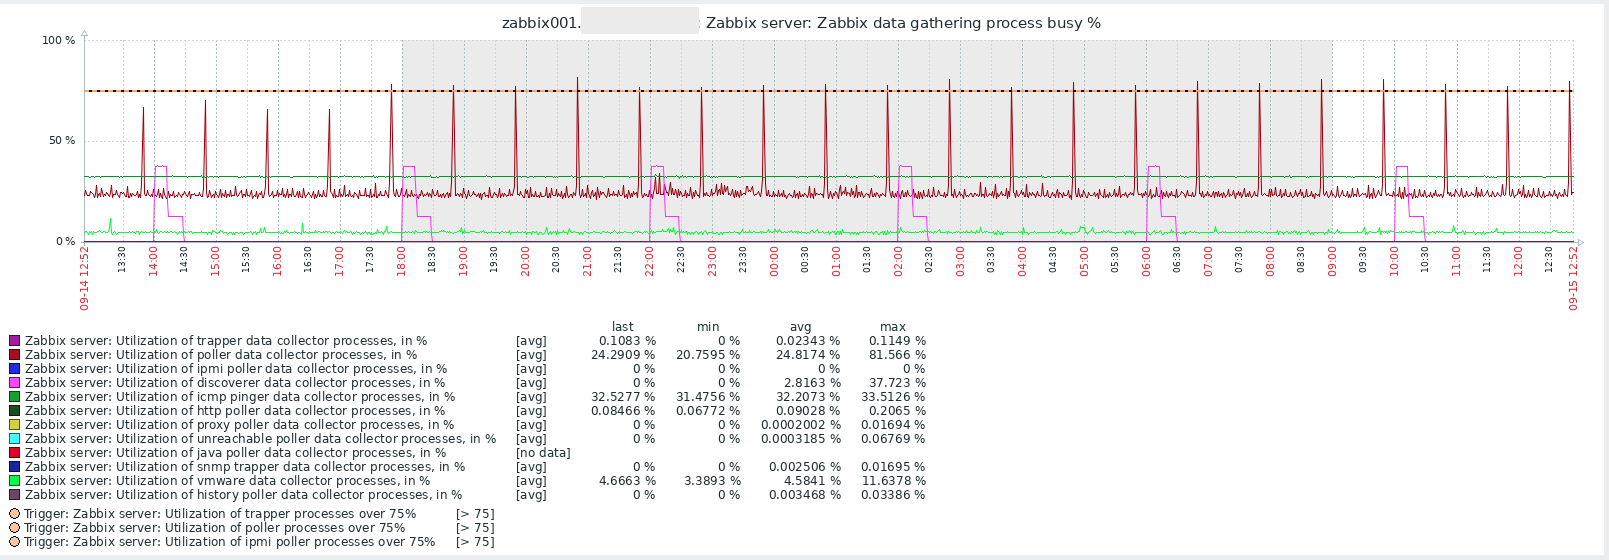
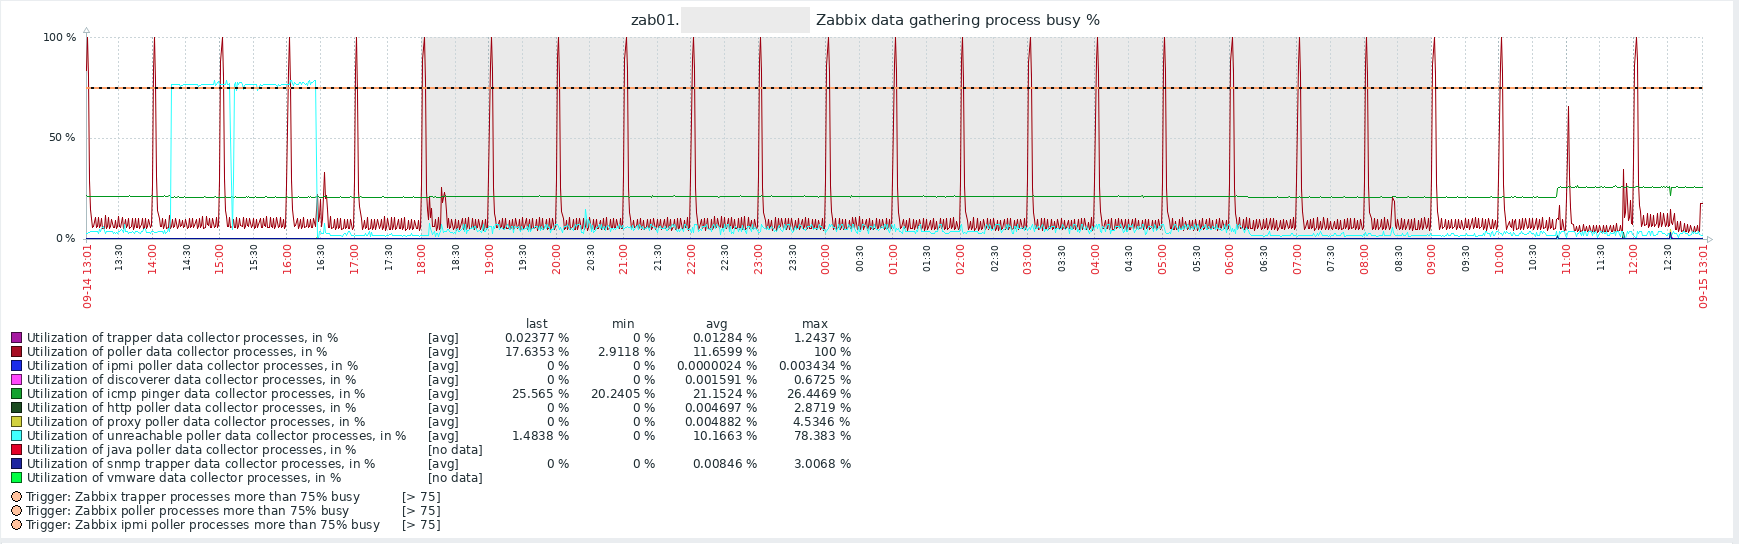
Every hour a peak in Poller Data Collector processes is shown. See screenshot.
Have the same issue at another customer, also every hour but at a different time.
Log files don't show why there is a queue, queue details show multiple devices, multiple items (not specific items, just general SNMP devices (interfaces etc) or zabbix-agent items (Linux by Zabbix agent template)).
No custom intervals are set, all type: Flexible.
Setting the StartPollers parameter higher eases the pain, but still a peak every hour.
Expected:
More spread item polling