-
Type:
Problem report
-
Resolution: Fixed
-
Priority:
 Trivial
-
None
-
Affects Version/s: 6.0.20
-
Component/s: Server (S)
-
None
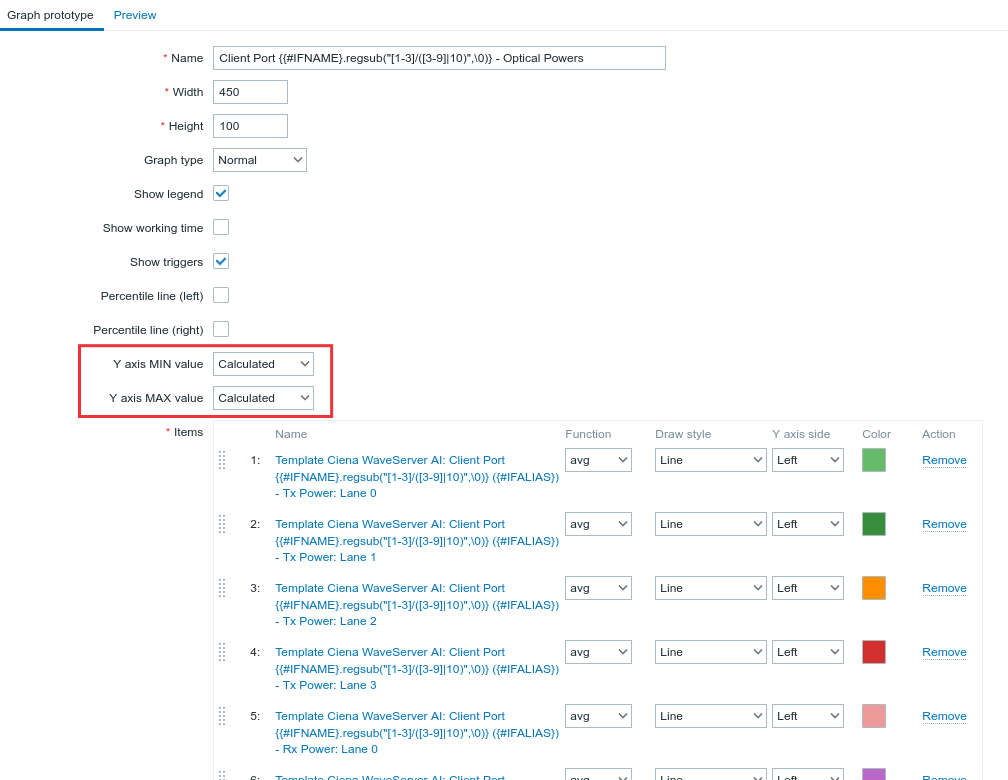
There is a graph protype with several items
These items may have positive and negative values. Y axis MIN and MAX values are calculated automatically according to the item values.

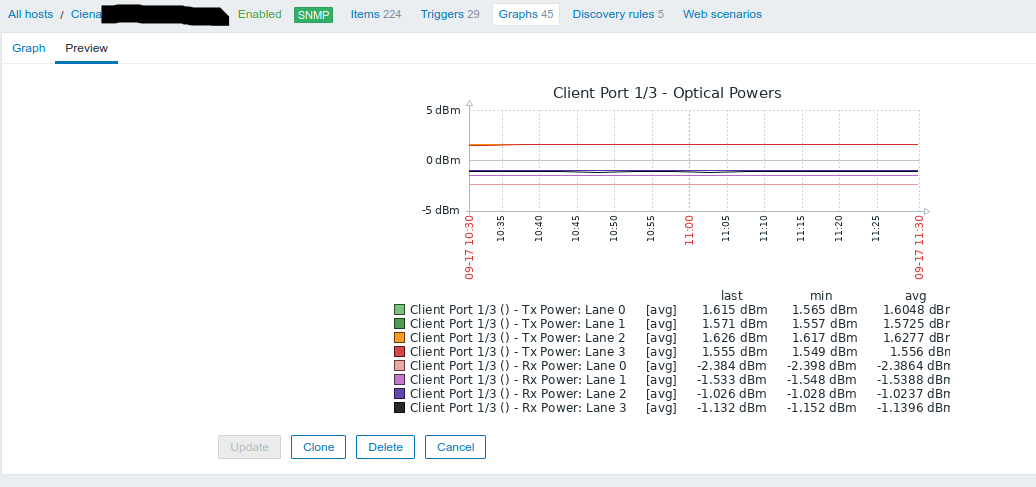
Graphs are created correctly{}
After LLD process runs, all graphs are created corretly and it's possible to see them in Host -> Graphs.
In this graph, it's possible to see there are positive and negative values.
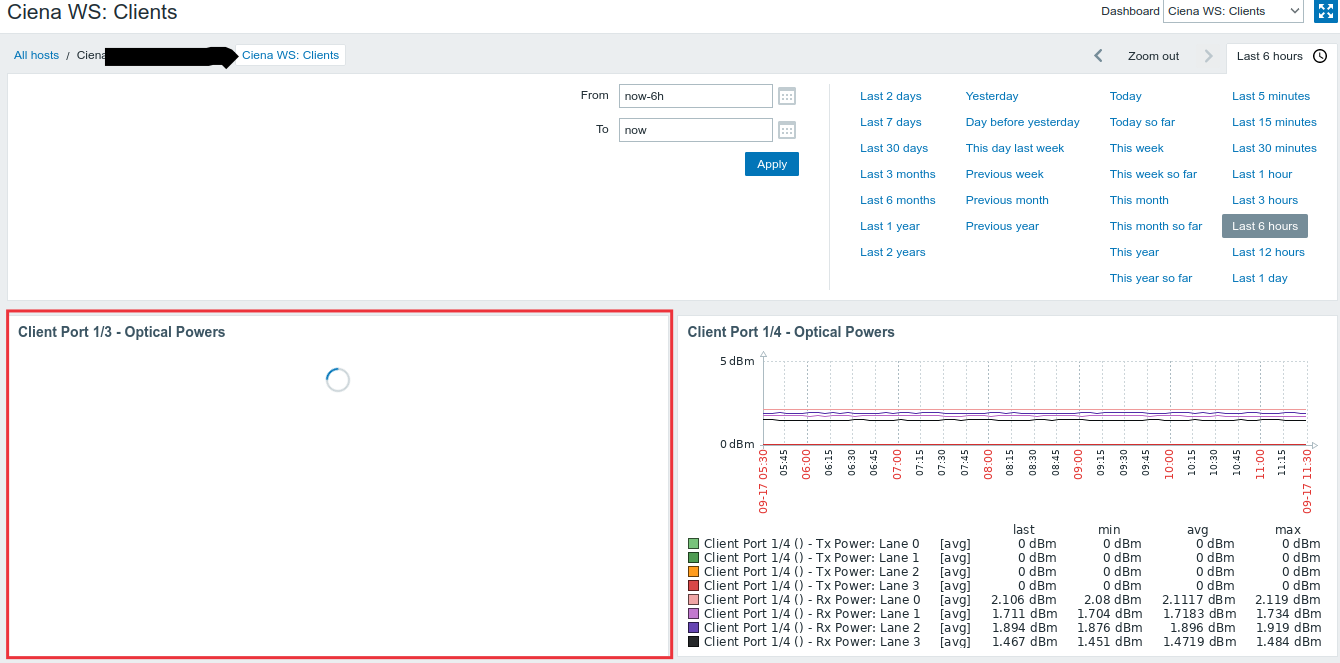
Graphs are not presented accordingly on dashboards
Although graphs are created correctly (as image above), some of them are not loaded in the dashboard view.
What I noticed: graphs containing positive and negative values are not loaded in dashboard view.

Changing Y axis MIN and MAX values to fixed values in graph prototypes
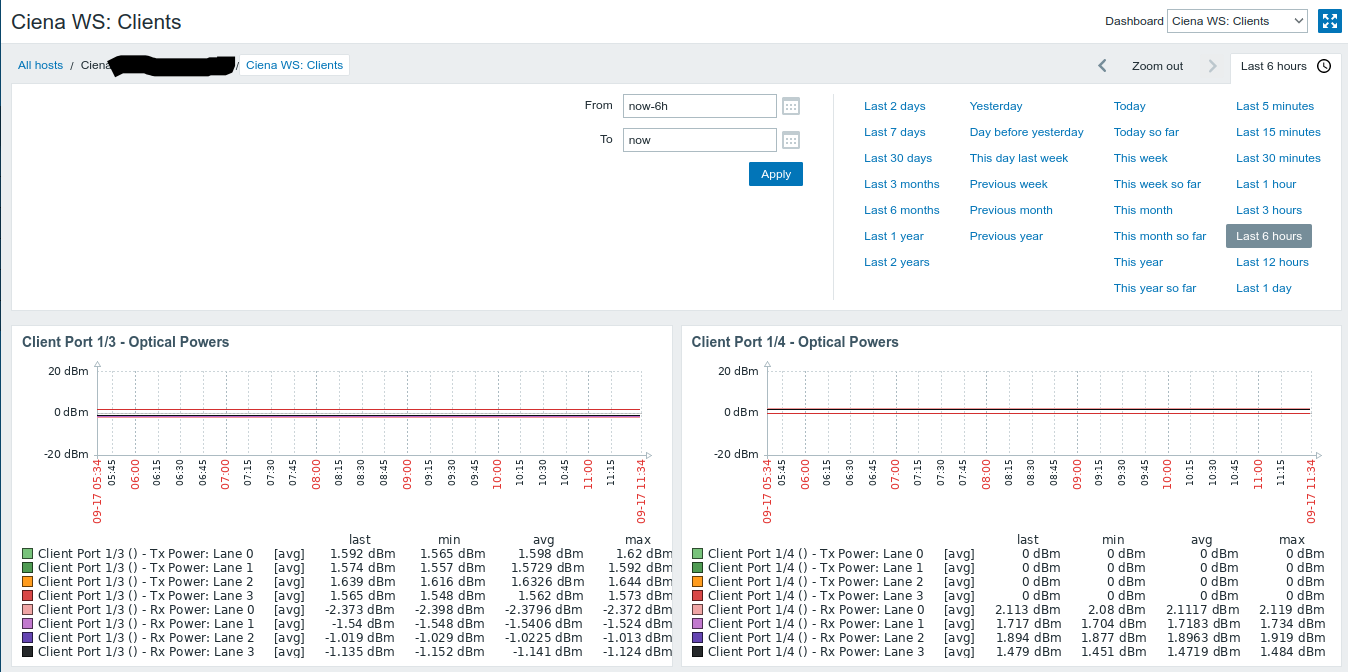
If Y axis MIN value is set to a fixed value (as in the imagem below), then grpahs are loaded in dashboards.
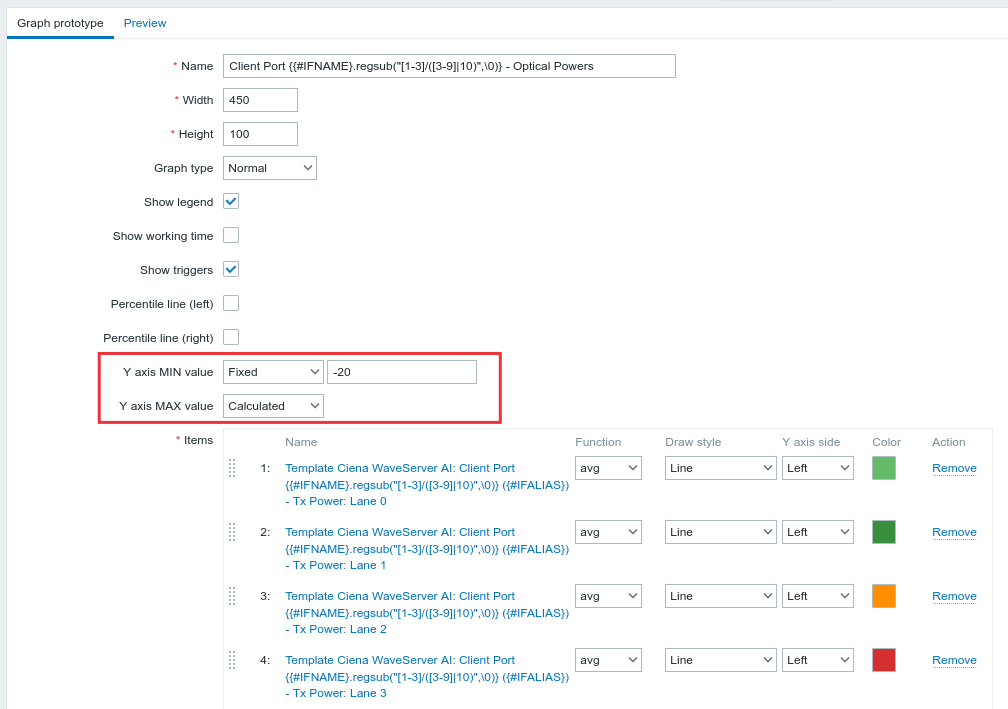
Now, graph for Client Port 1/3 - Optical Powers is loaded as expected (when Y axis MIN value is set to a fixed value)

It looks like Zabbix is not loading graphs generated by prototypes on dashboards in a given condition. In this case I'm reporting, all the graphs that contain positive and negative values are not loaded.