-
Type:
Problem report
-
Resolution: Unresolved
-
Priority:
 Critical
-
None
-
Affects Version/s: 6.0.22
-
Component/s: Frontend (F)
When adding a graph widget that uses the SUM function to aggregate trend data of bit rates for network interfaces, the resulting graphs show values that are significantly larger than when using history data.
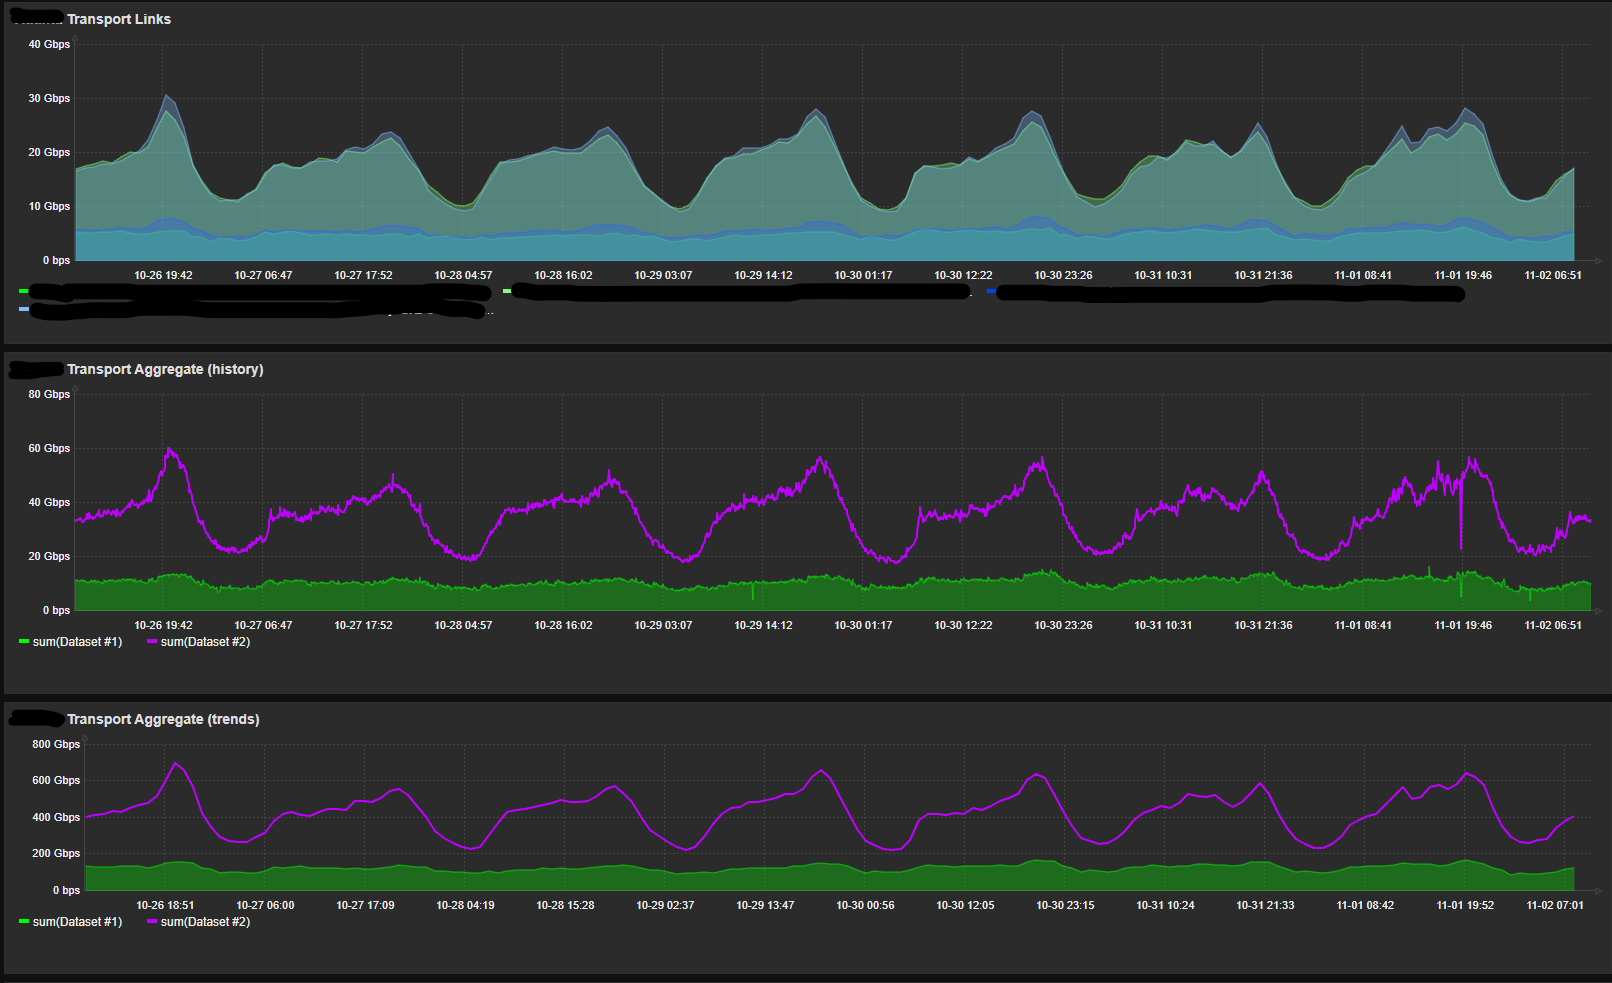
Referencing the screenshot below:
-Top graph is showing the individual bit rates over time for the Bits sent and Bits received for 2 different links to the same location.
-The middle graph shows a sum aggregate using history data for the same links in the top graph. The values shown on the history graph line up with what we would expect if the bit rates for the top graph are simply added together.
-The bottom graph is the same as the middle graph but using trends is specified instead of history. The graph follows the same shape as the history one, but the values are inexplicably higher. They seem to be multiplied by something not configurable on the frontend.
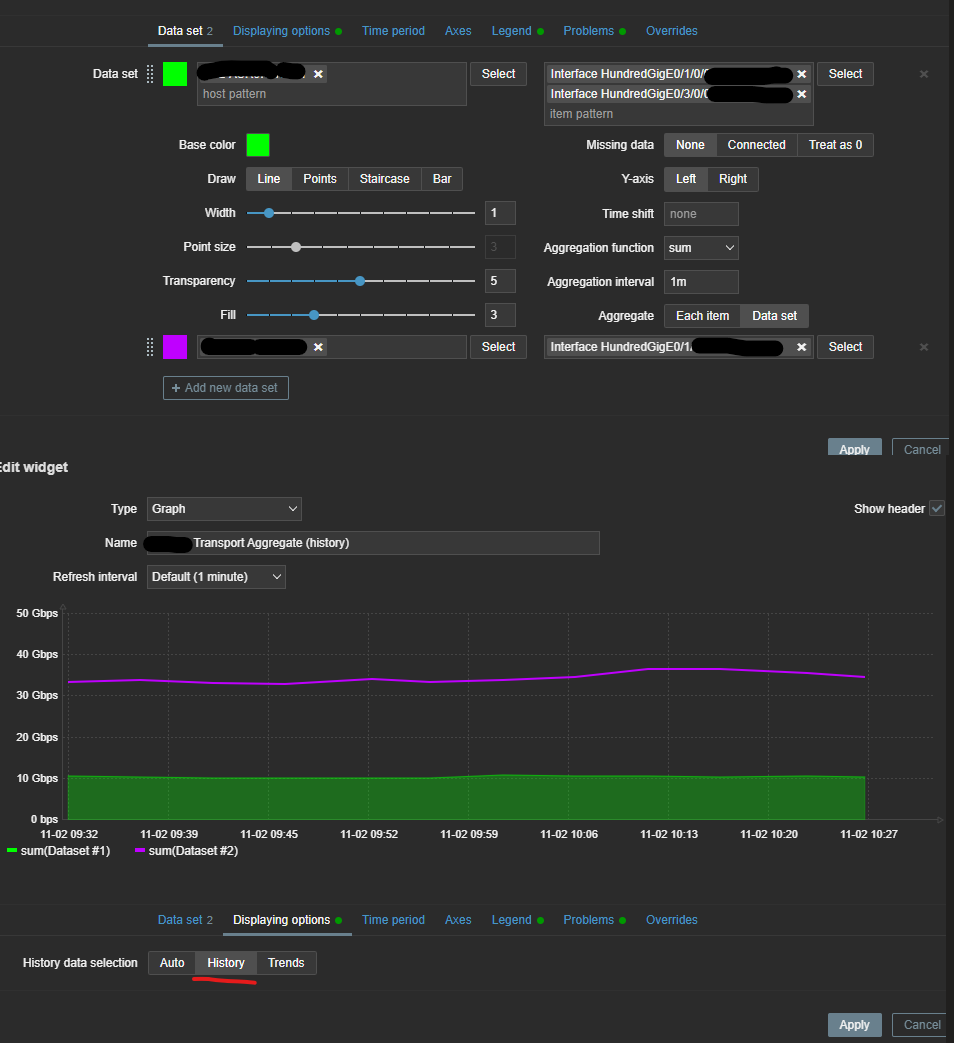
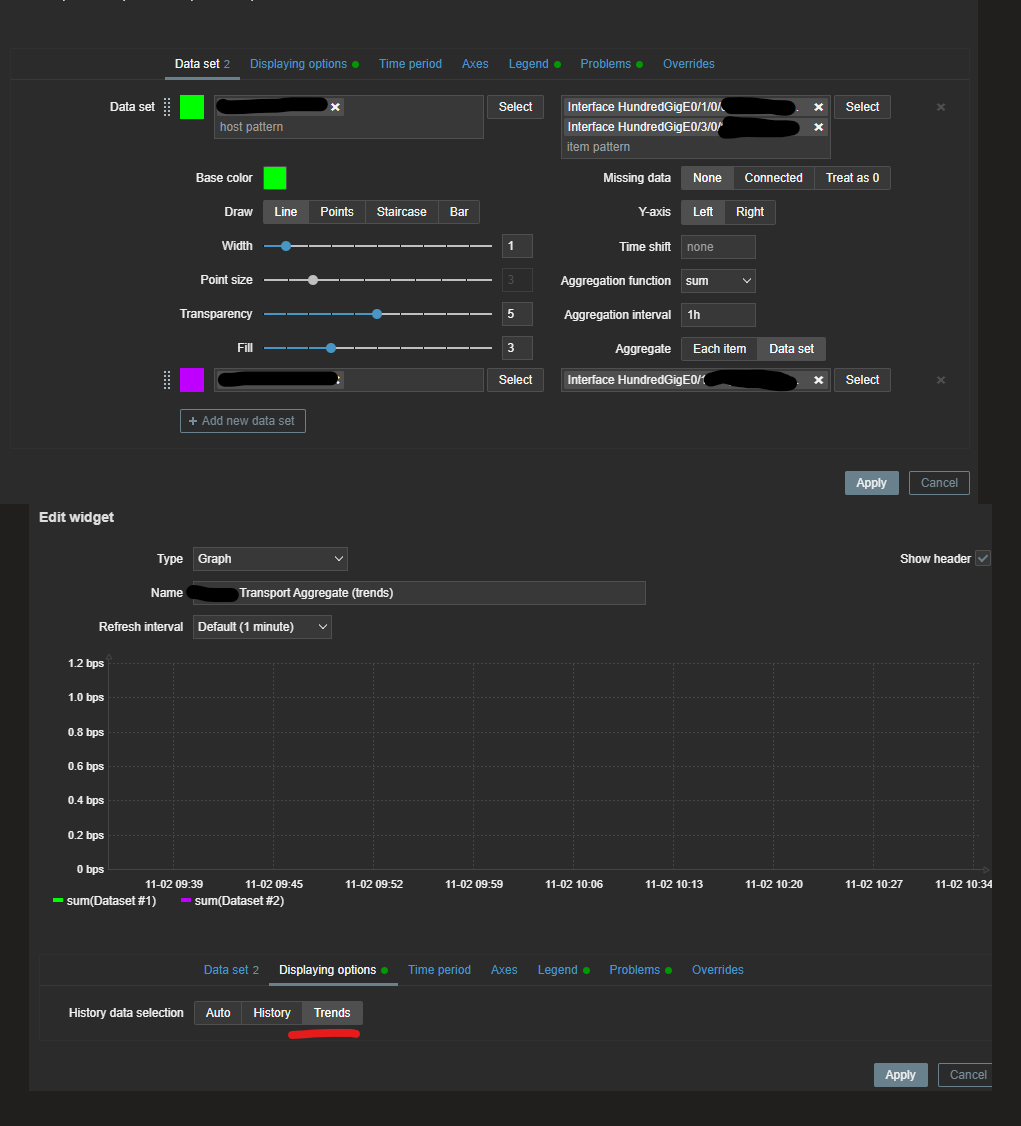
I've also attached the settings for the two aggregate graphs for reference.
I've seen this issue listed in a feature request but this seems more like a bug since the resulting trend graph isn't useful because the values returned have no basis in reality. Forcing the graph to use history is our current workaround but it only works for 90days when history data rolls up into trends. This means we do not have useful graphing data for anything further than 90 days. Increasing history retention is not feasible.
Our production Zabbix server is on 6.0.22 but I've seen similar behavior on our test 6.4x environment.
Steps to reproduce:
- Create a dashboard graph widget that uses the SUM function to aggregate interface bit rates.
- Under "Displaying options" select Trends for "History data selection" and apply
Result:
See screenshot...

Resulting values are an order of magnitude larger than expected values.
Expected:
See screenshot....
When using "History" data as opposed to "Trends" the resulting graph values show the expected sum of the bit rates. Using trend data should return similar values.
- part of
-
ZBXNEXT-8634 Add Custom Multiplier to Graph Widget Data Sets
-

- Open
-
-
-

- Open
-