-
Type:
Problem report
-
Resolution: Fixed
-
Priority:
 Trivial
-
Affects Version/s: 7.0.0alpha9
-
Component/s: Frontend (F)
-
None
-
Sprint 107 (Dec 2023), S2401, S24-W6/7
-
0.5
Steps to reproduce:
- Navigate to Monitoring->Hosts->Dashboards (Zabbix server host).
- Select Zabbix server health tab.
- Click on Zabbix server: Zabbix cache usage, % free. (open the charts view)
- Try to select a time period in the graph.
Result:
Time period is not selected + JavaScript console error. See screenshot:
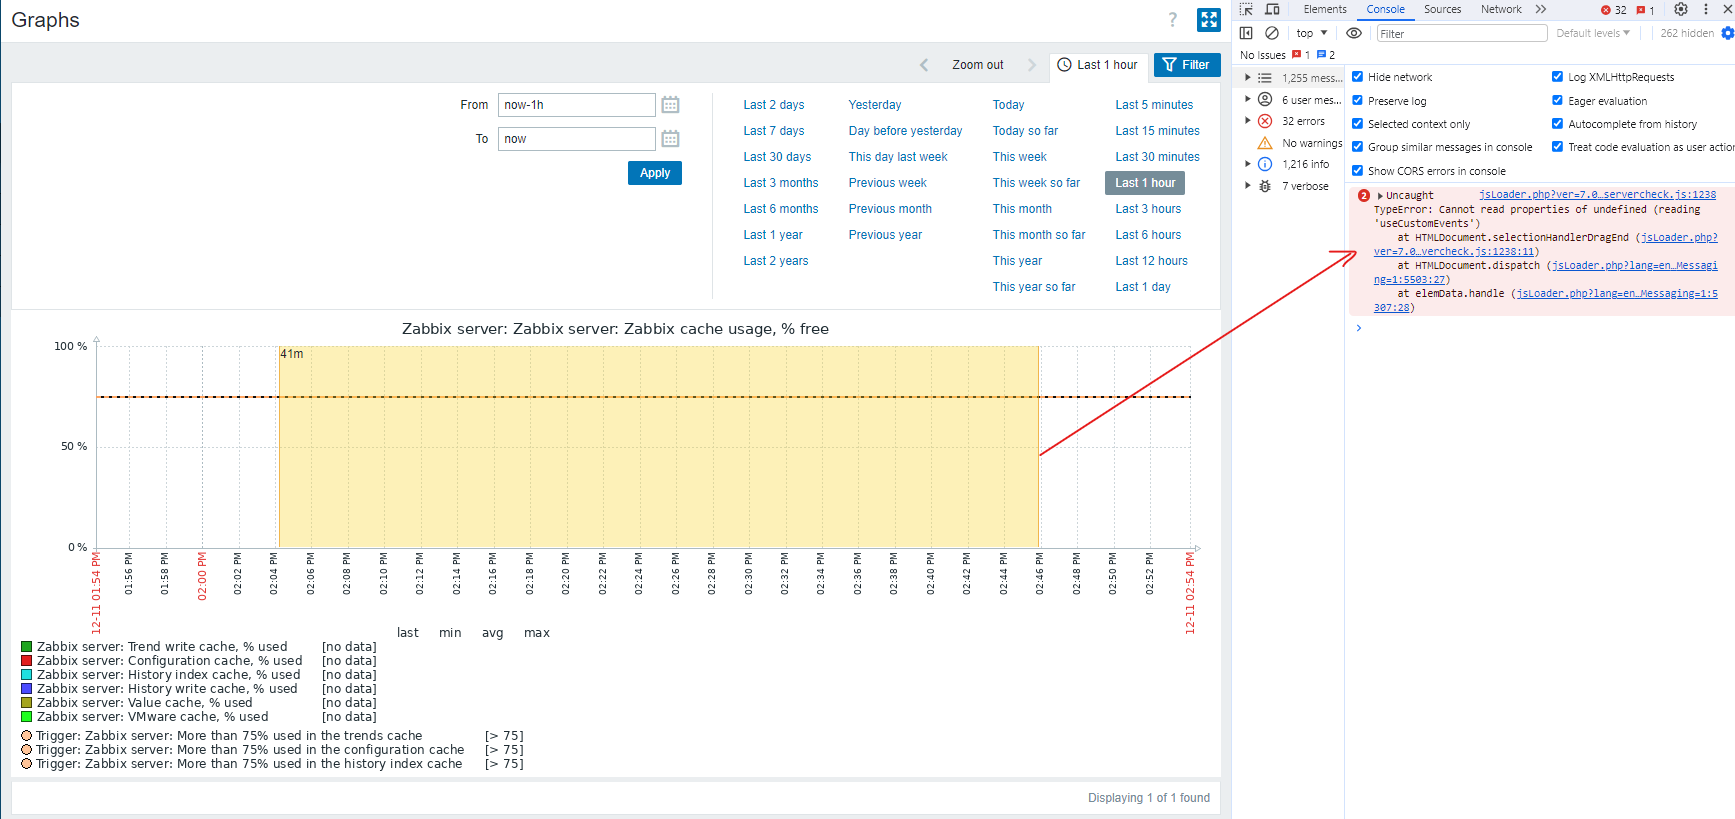
Expected:
Time period selected with no error.
Note: No error in console, if choosing a time period for the same graph while in host.dashboard.view. Error occurs only when specific graph is opened (charts.view).

