-
Type:
Documentation task
-
Resolution: Fixed
-
Priority:
Major
-
Affects Version/s: 6.0.25
-
Component/s: Documentation (D)
-
Documentation backlog, S24-W8/9, DOC S25-W2/3
-
1
Steps to reproduce:
- Create some item with "Type of information"="Numeric (unsigned)" and Units="uptime" (for example, the standard "system.uptime" metric from some OS template);
- Create a duplicate item with the same "Type of information"="Numeric (unsigned)", "Type"="Dependent", master item = <created on the previous step>, Units="s";
- Put to a dashboard 2 widgets with type="Item value" and select for them just created items (default config should be enough);
- Compare visualization of these items on the "Latest data" screen and on the dashboard.
Result:
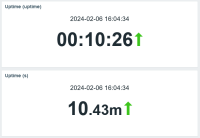
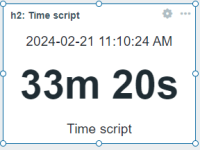
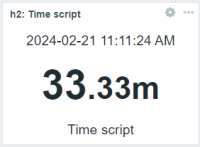
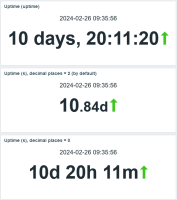
See screenshots attached.
"Latest data" screen displays identical values (for example, "00:10:26" and "10m 26s"); but the dashboard does not transform seconds into a minutes for the "s" units: is displays the same "00:10:26" for the "uptime" units, but "10.43m" for the "s" units.
Expected:
Correct time transformation into a string, as described in the documentation:
s - translated to "yyy mmm ddd hhh mmm sss ms"; parameter is treated as number of seconds.
For example, if you receive the value as 881764 (seconds), it will be displayed as "10d 4h 56m"
- is duplicated by
-
ZBX-25591 Dashboard Widget Item Value show wrong value in time unit
-
- Closed
-


