-
Type:
Problem report
-
Resolution: Fixed
-
Priority:
 Trivial
-
None
-
Affects Version/s: 6.0.26
-
Component/s: Agent2 plugin (G)
-
None
-
2
We are trying to monitor some MongoDB nodes with zabbix agent 2 version 6.0.26, as we need to authenticate with Mongo using TLS certificate we had to define a Session in config file as:
Plugins.MongoDB.System.Path=/usr/sbin/zabbix-agent2-plugin/zabbix-agent2-plugin-mongodb
Plugins.MongoDB.Sessions.Prod.Uri=tcp://HOST.mongodb.DOMAIN.com:27017
Plugins.MongoDB.Sessions.Prod.User=zabbix
Plugins.MongoDB.Sessions.Prod.Password=********
Plugins.MongoDB.Sessions.Prod.TLSConnect=verify_ca
Plugins.MongoDB.Sessions.Prod.TLSCAFile=/etc/zabbix/mongo-ca.crt
We are using template MongoDB node by Zabbix agent 2, for this config we had to change items key to use Session and not connect string/user/pass macros.
Everything is looking fine regarding monitoring, items are able to gather stats, ping, collections and db list with Discovery rules.
Steps
1. The problem starts when we stop mongo db service, we got the alerts as we should for that but some minutes later the host in the frontend becomes unavailable throwing ZBX TCP Read TimedOut, Host Availability becomes red and Zabbix proxy logs are showing:
48520:20240314:143542.085 Zabbix agent item "mongodb.collection.stats["{$MONGODB.SESSION}",,,"amdm_dev_schedule","core_non_training_slots"]" on host "HOST.mongodb.DOMAIN.com" failed: first network error, wait for 15 seconds
48495:20240314:143549.919 unknown request received from "10.234.16.215": [active check heartbeat]
48522:20240314:143601.302 Zabbix agent item "mongodb.collection.stats"{{color:#FF0000}$MONGODB.SESSION}",,,"amdm_dev_schedule","tempt"" on host "HOST.mongodb.DOMAIN.com" failed: another network error, wait for 15 seconds
48522:20240314:143620.317 Zabbix agent item "mongodb.collection.stats["\{$MONGODB.SESSION}",,,"schedule","host_market_shares"]" on host "HOST.mongodb.DOMAIN.com" failed: another network error, wait for 15 seconds
48494:20240314:143631.044 unknown request received from "10.234.7.37": [active check heartbeat]
48495:20240314:143634.373 unknown request received from "10.234.15.27": [active check heartbeat]
48522:20240314:143639.413 temporarily disabling Zabbix agent checks on host "HOST.mongodb.DOMAIN.com": interface unavailable
Those Mongo items are zabbix agent (passive).
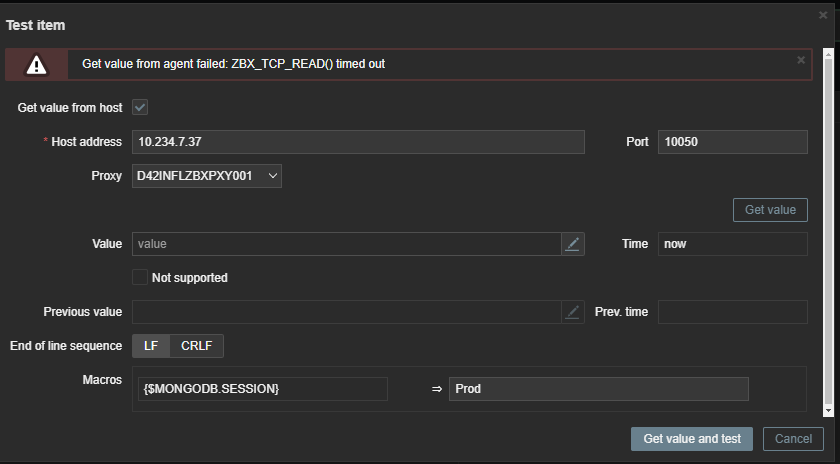
2. Besides that, when we start again mongo db service, the monitoring does not recover, even if we try to test an item manually

Note: we tried also changing the Mongo item types from passive to active, this way when we stop the mongo service the host does not become unavailable in zabbix frontend, but when we start the Mongo service again, even then the monitoring does not recover, we have wait for 30 minutes or more the the latest value for Mongo items are before the mongo service was stopped. The other standar linux monitoring like cpu, memory, etc is not interrupted any time.
The only way to solve this is restarting zabbix-agent2 service.