-
Type:
Problem report
-
Resolution: Fixed
-
Priority:
 Major
Major
-
Affects Version/s: 6.4.13, 6.4.14
-
Component/s: Server (S), Templates (T)
-
Environment:SLES 15 SP5
K3s v1.27.13+k3s1
-
S25-W40/41, S25-W42/43
-
2
We have set up a few K3s clusters, monitored by Zabbix using the Zabbix provided Kubernetes templates (updated to latest available for git.zabbix.com tag 6.4.14) and helm charts.
Most clusters do not yet have much workload, and are monitored without problems using these resource limits on the proxy pod in the cluster:
requests:
memory: "128Mi"
cpu: "250m"
limits:
memory: "8Gi"
cpu: "2000m"
The biggest cluster of those that work without problems, running 18 deployments, 39 replicasets and 41 pods running on 3 cp and 4 worker nodes, monitors around 18000 items on 29 hosts. Proxy pollers are around 1.1% busy and preprocessor manager around 1.9% and the preprocessor workers around 15% (using the default proxy setting of 3 preprocessors).
However one cluster (also 3 cp's, 4 workers) has a much higher load of 192 deployments, 523 replicasets (most of them are 'old', inactive sets that are keps by kubernetes for deployment rollback purposes) and 221 pods. I don't think this is already a very big load for a kubernetes cluster, and there are also about 120 additional projects scheduled to be deployed on that cluster, so the load will only grow.
I have already altered the Kubernetes cluster state template to skip replicasets with 0 replica's to filter out the inactive replicasets preventing about 1500 extra items from being discovered. This currently results in Zabbix trying to monitor +/- 26000 items on 29 hosts for that cluster.
This however proves to be very challenging for the Proxy on that cluster as the 3 default preprocessors are 100% busy and the proxy crashes regularly due to a lack of available preprocessor workers. So we start scaling up the proxy. Currently it is set to
requests:
memory: "8Gi"
cpu: "6000m"
limits:
memory: "16Gi"
cpu: "12000m"
And the number of preprocessors has been increased to
ZBX_STARTPREPROCESSORS: 60
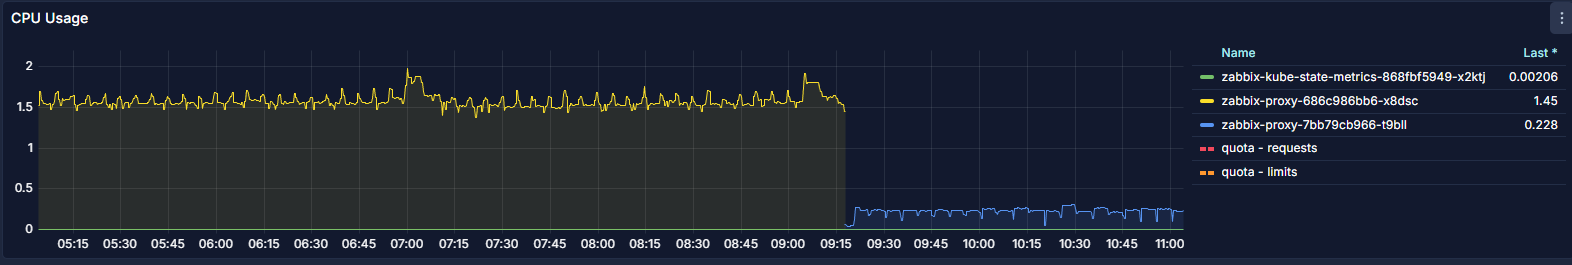
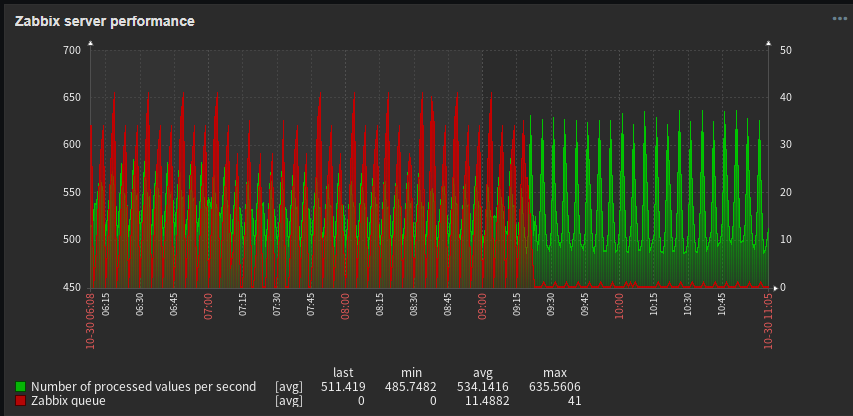
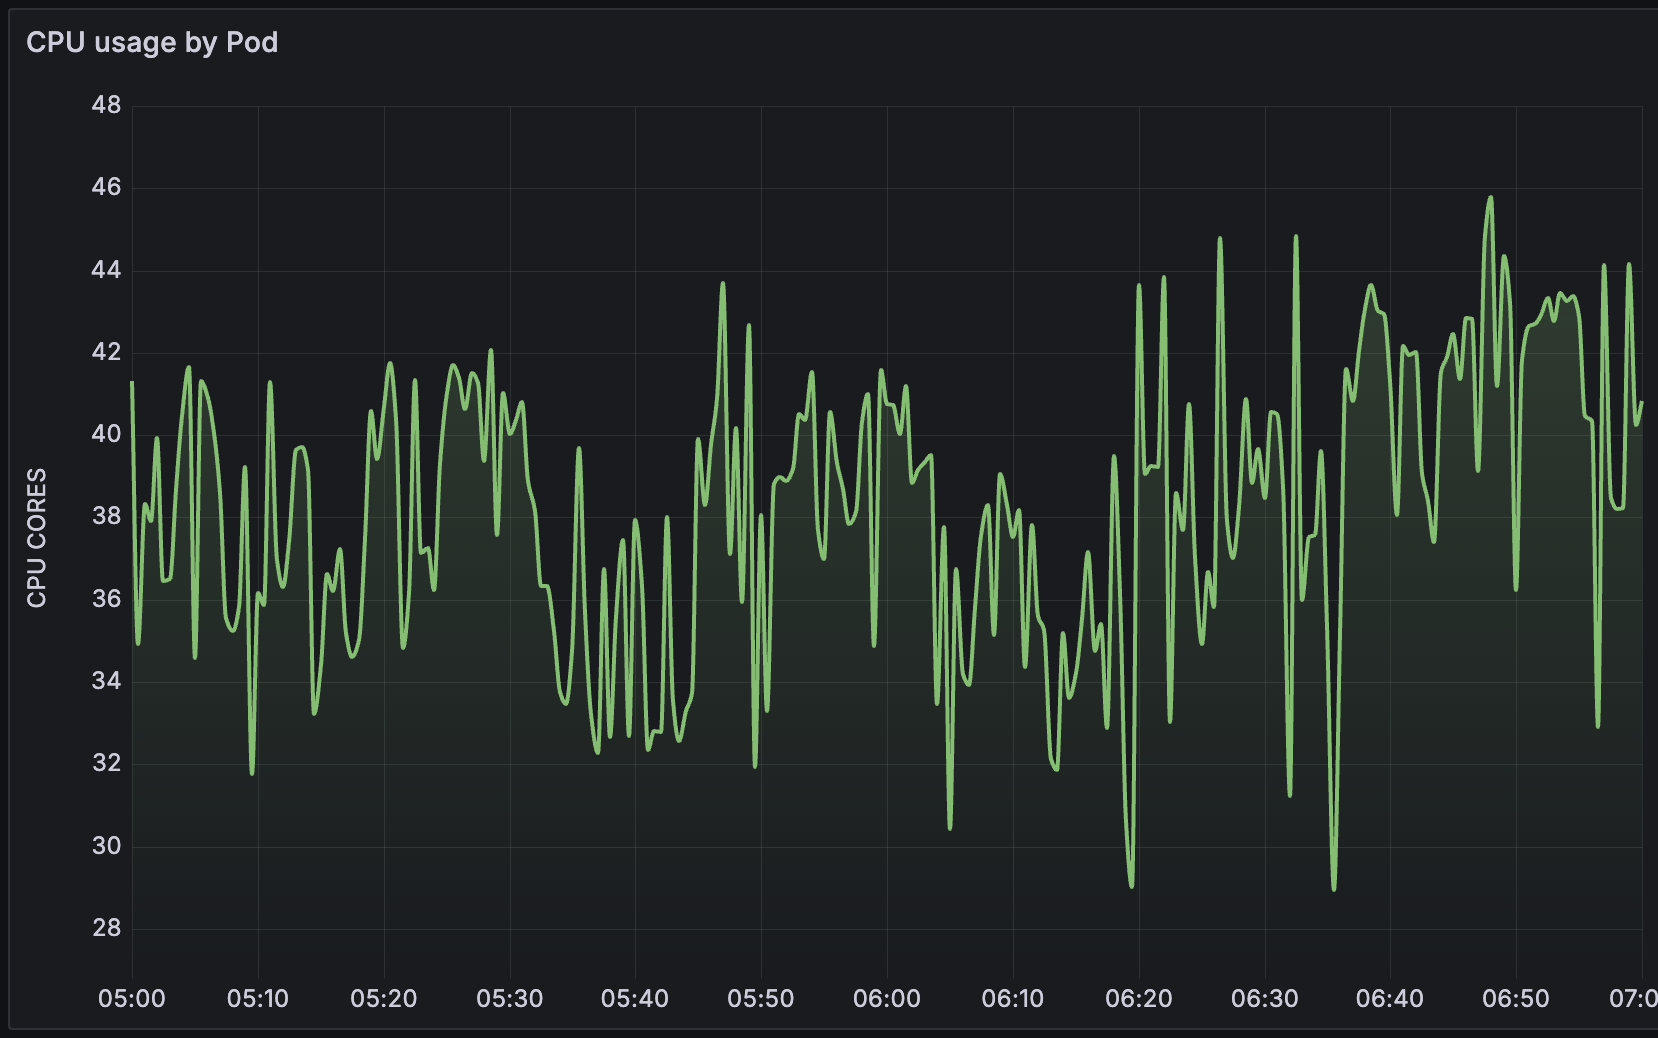
Now the preprocessor worker processes are about 80% busy but the preprocessor manager is now at 100% and the poller processes went up to also being 100% busy. Still causing many items to not get processed in time and over 700 items in queue > 10 min. The actual CPU usage of the proxy pod is constantly around 7.5 CPU's and the pod gets OOM killed about every 2 to 3 hours due to hitting the memory limit.
I could still up the allowed resources, preprocessors and pollers. But I think this getting way out of proportion, the consumed resources, only for monitoring.
Also it strikes me that with only the defaults it is able to monitor 18000 items, but only 8000 more items would suddenly need over 60 preprocessors more, and at least 3 times the default resource limits. This looks to me like there is some turnover point where resources are suddenly exponentially required for only a little more data.
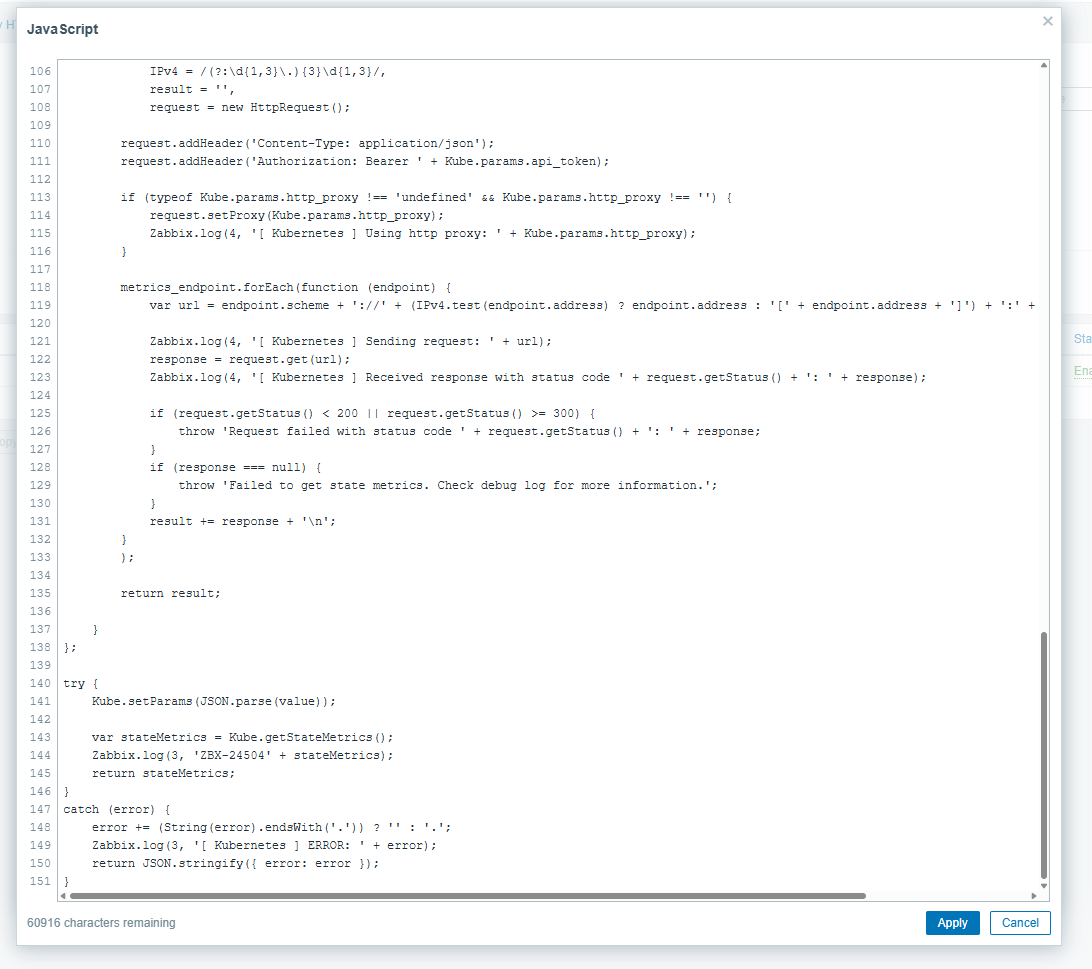
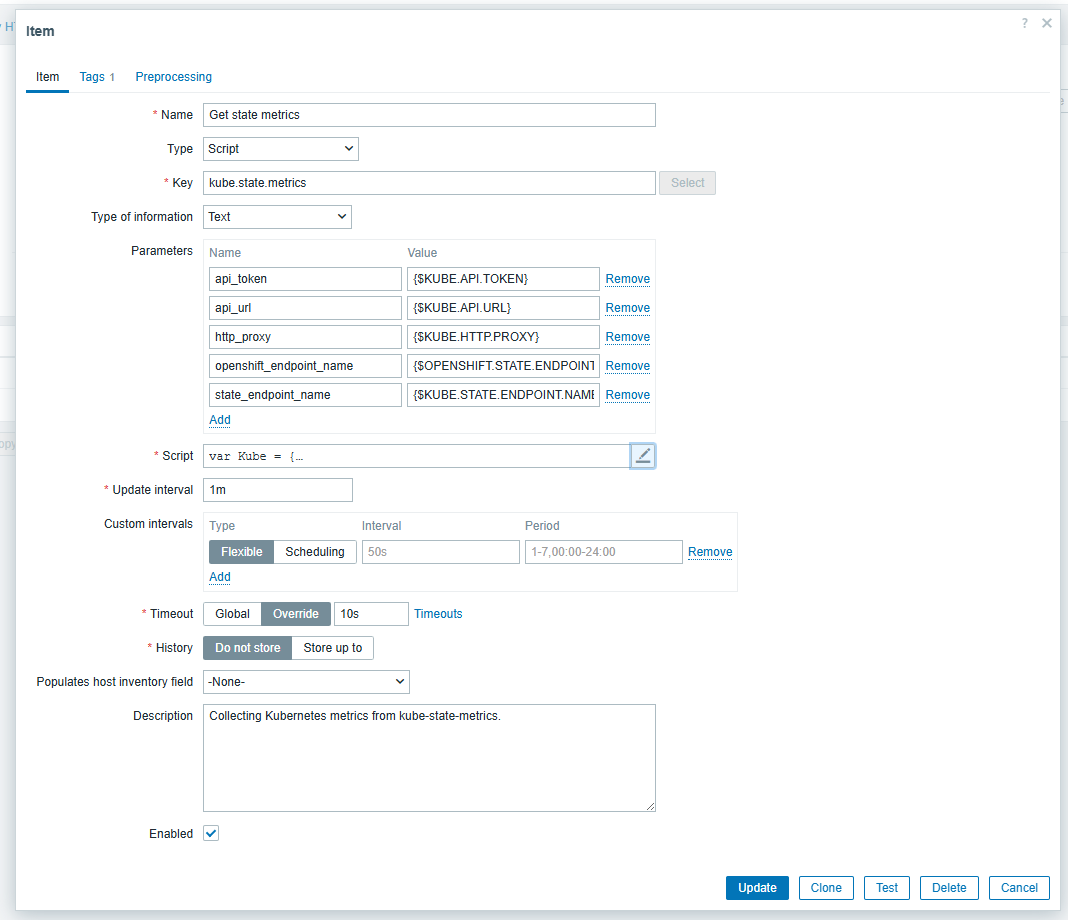
The culprit seems to be the Kubernetes cluster state by HTTP template: Get state metrics which currently returns 37113 lines on that cluster and is then preprocessed by almost all other discovered items.
Possibly the preprocessing can be optimized? And/or the template itself?

- depends on
-
-
- Confirmed
-

