-
Type:
Problem report
-
Resolution: Unresolved
-
Priority:
Trivial
-
None
-
Affects Version/s: 6.0.31rc1, 6.4.16rc1, 7.2.0alpha1
-
Component/s: Frontend (F)
-
S24-W48/49, S25-W30/31
Steps to reproduce:
- Download appliance for latest 6.0+ zabbix version
- Start server
- Go to Monitoring -> Hosts -> Zabbix server -> Dashboards
- Open "Zabbix server health" tab
Result:
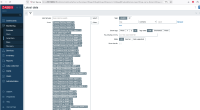
Some graphs aren't available due to 414 Request-URI Too Large
For example "Zabbix server: Zabbix data gathering process busy"
Expected:
We will fix appliance config for the next releases, but this is not the root cause. The Graph (classic) widget should also be fixed.
If you keep URLs under 2000 characters, they'll work in virtually any combination of client and server software, and any search engine.


