-
Type:
Problem report
-
Resolution: Commercial support required
-
Priority:
 Trivial
-
None
-
Affects Version/s: 6.0.30
-
Component/s: Frontend (F), Server (S)
-
Environment:Ubuntu 22.04.4 LTS Server Virtual Machine
Zabbix Server 6.0.30
8 CPU
24 GB RAM
I have a problem with breaks in my zabbix graphs.
I use this zabbix installation to monitor the network load of the switch in our company.
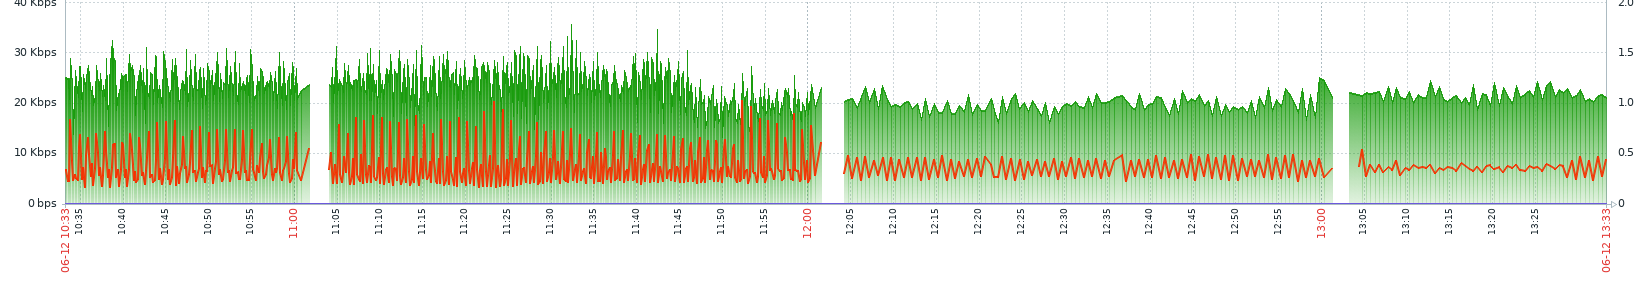
Basically all my graphs on all my swicthes have this breaks in them.
Were all allways at the same time every hour.
This System is never above 40% CPU and 70% RAM.
Because this problem occurs every hour at the exat same time I dont think this is a performance issue.
I tried changing the check interval times for bits received and sent between 30 an 10 seconds with no help.
I heard that bigger intervals could fix this issue but I need a small interval time to detect small networkpeaks better.
Is there a something I can try?
