-
Type:
Problem report
-
Resolution: Won't Do
-
Priority:
 Trivial
-
None
-
Affects Version/s: 6.4.17
-
Component/s: Templates (T)
-
Environment:Zabbix server 6.4.17. on debian 12
Good day!
I found a problem and need your help to solve it.
I work with Zabbix 6.4.17., made changes to the VMware Hypervisor template.
To track changes in the pool size, I added a calculated item to this template:
Key: vmware.hv.datastore.multipathSum[\{$VMWARE.URL},\{$VMWARE.HV.UUID}]
Aggregation: sum(min_foreach(//vmware.hv.datastore.multipath[\{$VMWARE.URL},\{$VMWARE.HV.UUID},*],1m))
During preparation, I was guided by the documentation https://www.zabbix.com/documentation/current/en/manual/vm_monitoring/vmware_keys#vmware.hv.datastore.multipath
and the Behavior depending on availability table at https://www.zabbix.com/documentation/current/en/manual/appendix/functions/aggregate/foreach
Conclusion: I discovered that the formulas do not work as expected in the Behavior table depending on availability.
Problems:
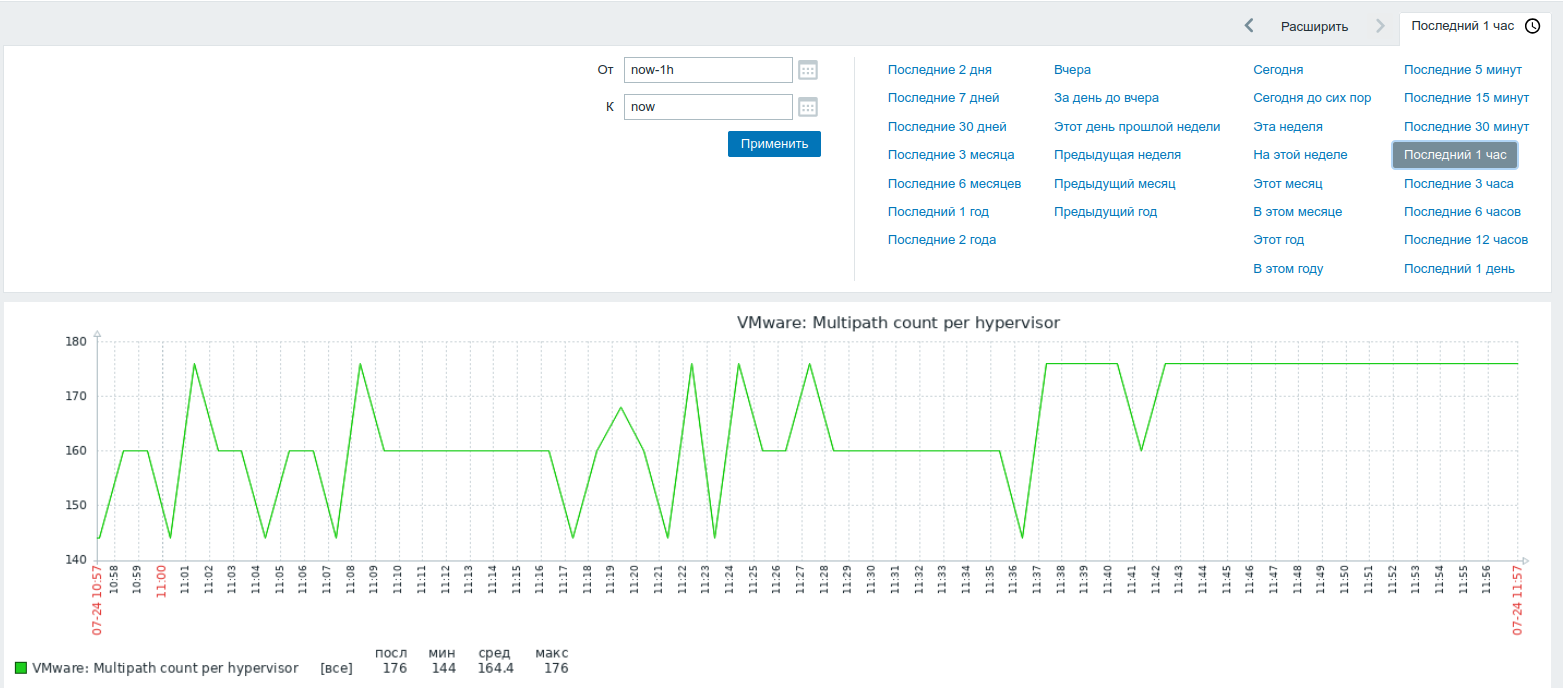
With Aggregarion sum(min_foreach(//vmware.hv.datastore.multipath[\{$VMWARE.URL},\{$VMWARE.HV.UUID},*],1m))
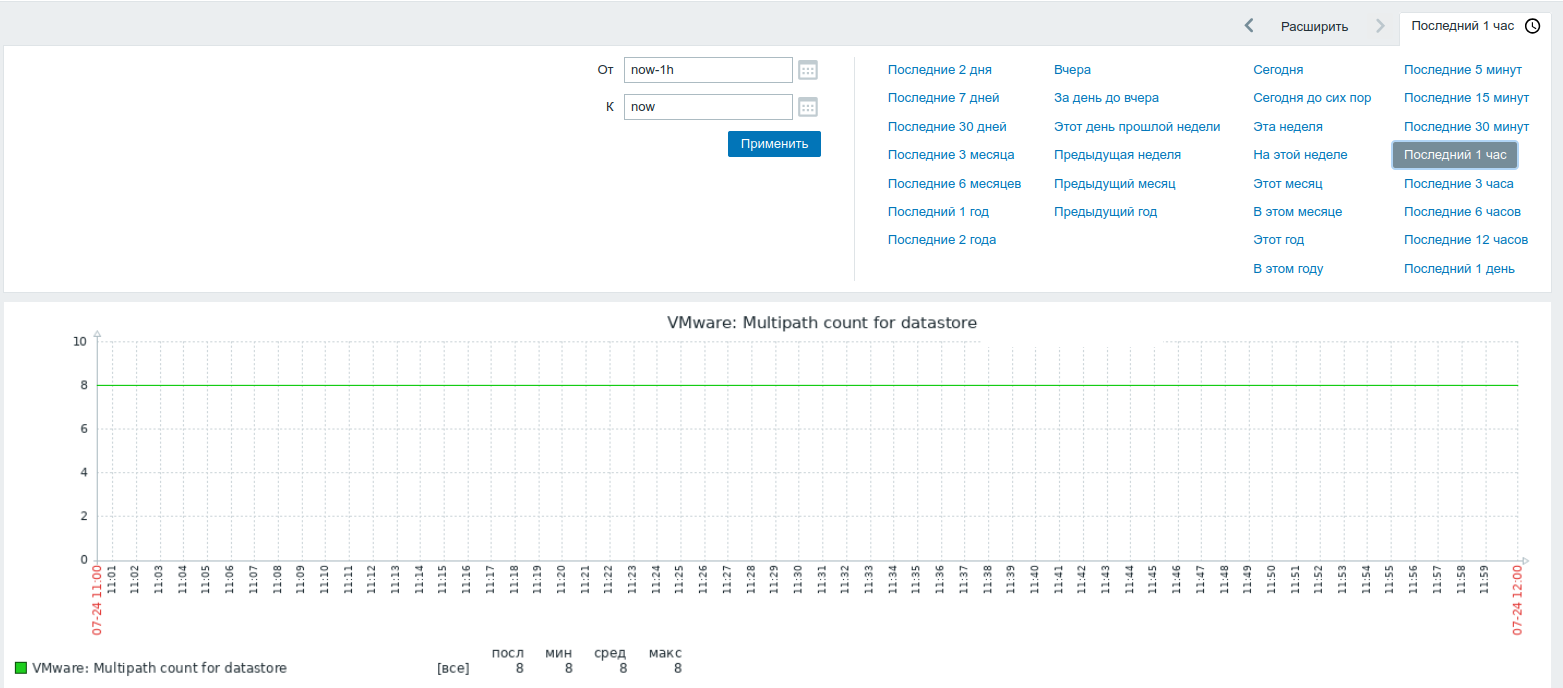
we get floating values although the item metric values are constant.
With Aggregation sum(last_foreach(//vmware.hv.datastore.multipath[\{$VMWARE.URL},\{$VMWARE.HV.UUID},*]))
there are unsupported metrics, but suddenly they are used by sum too as opposed to documentation https://www.zabbix.com/documentation/current/en/manual/appendix/functions/aggregate/foreach
Attach screenshots below.