-
Type:
Problem report
-
Resolution: Fixed
-
Priority:
Trivial
-
Affects Version/s: 6.0.32, 7.0.2
-
Component/s: Frontend (F)
-
None
-
S24-W34/35, S24-W36/37
-
0.5
Steps to reproduce:
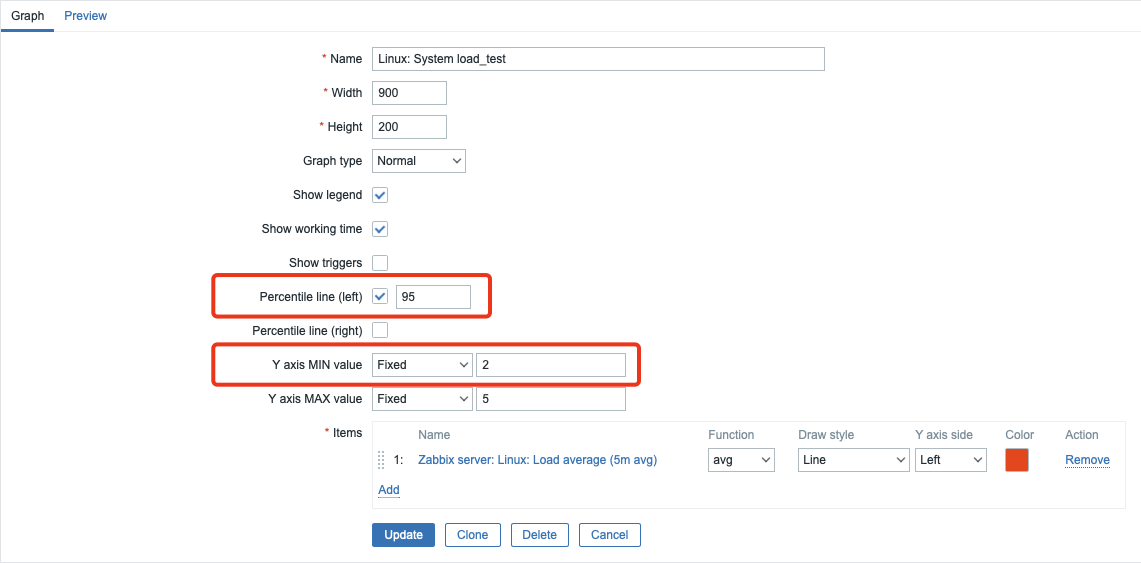
Configure graph, where calculated data will be lower than Y axis MIN value, for example:

Result:
Green percentile line is drawn below the graph canvas:

Expected:
Line drawn in designated area


