-
Type:
Incident report
-
Resolution: Unresolved
-
Priority:
 Trivial
-
None
-
Affects Version/s: None
-
Component/s: Frontend (F)
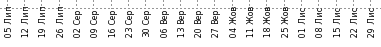
in availability reports, x axis labels overlap with the graph area. if there's no data, they bleed into chart wall, if there's data, data bars are drawn on top of the overlapping label part.