-
Type:
Problem report
-
Resolution: Incomplete
-
Priority:
 Trivial
-
None
-
Affects Version/s: None
-
Component/s: None
-
None
Hi,
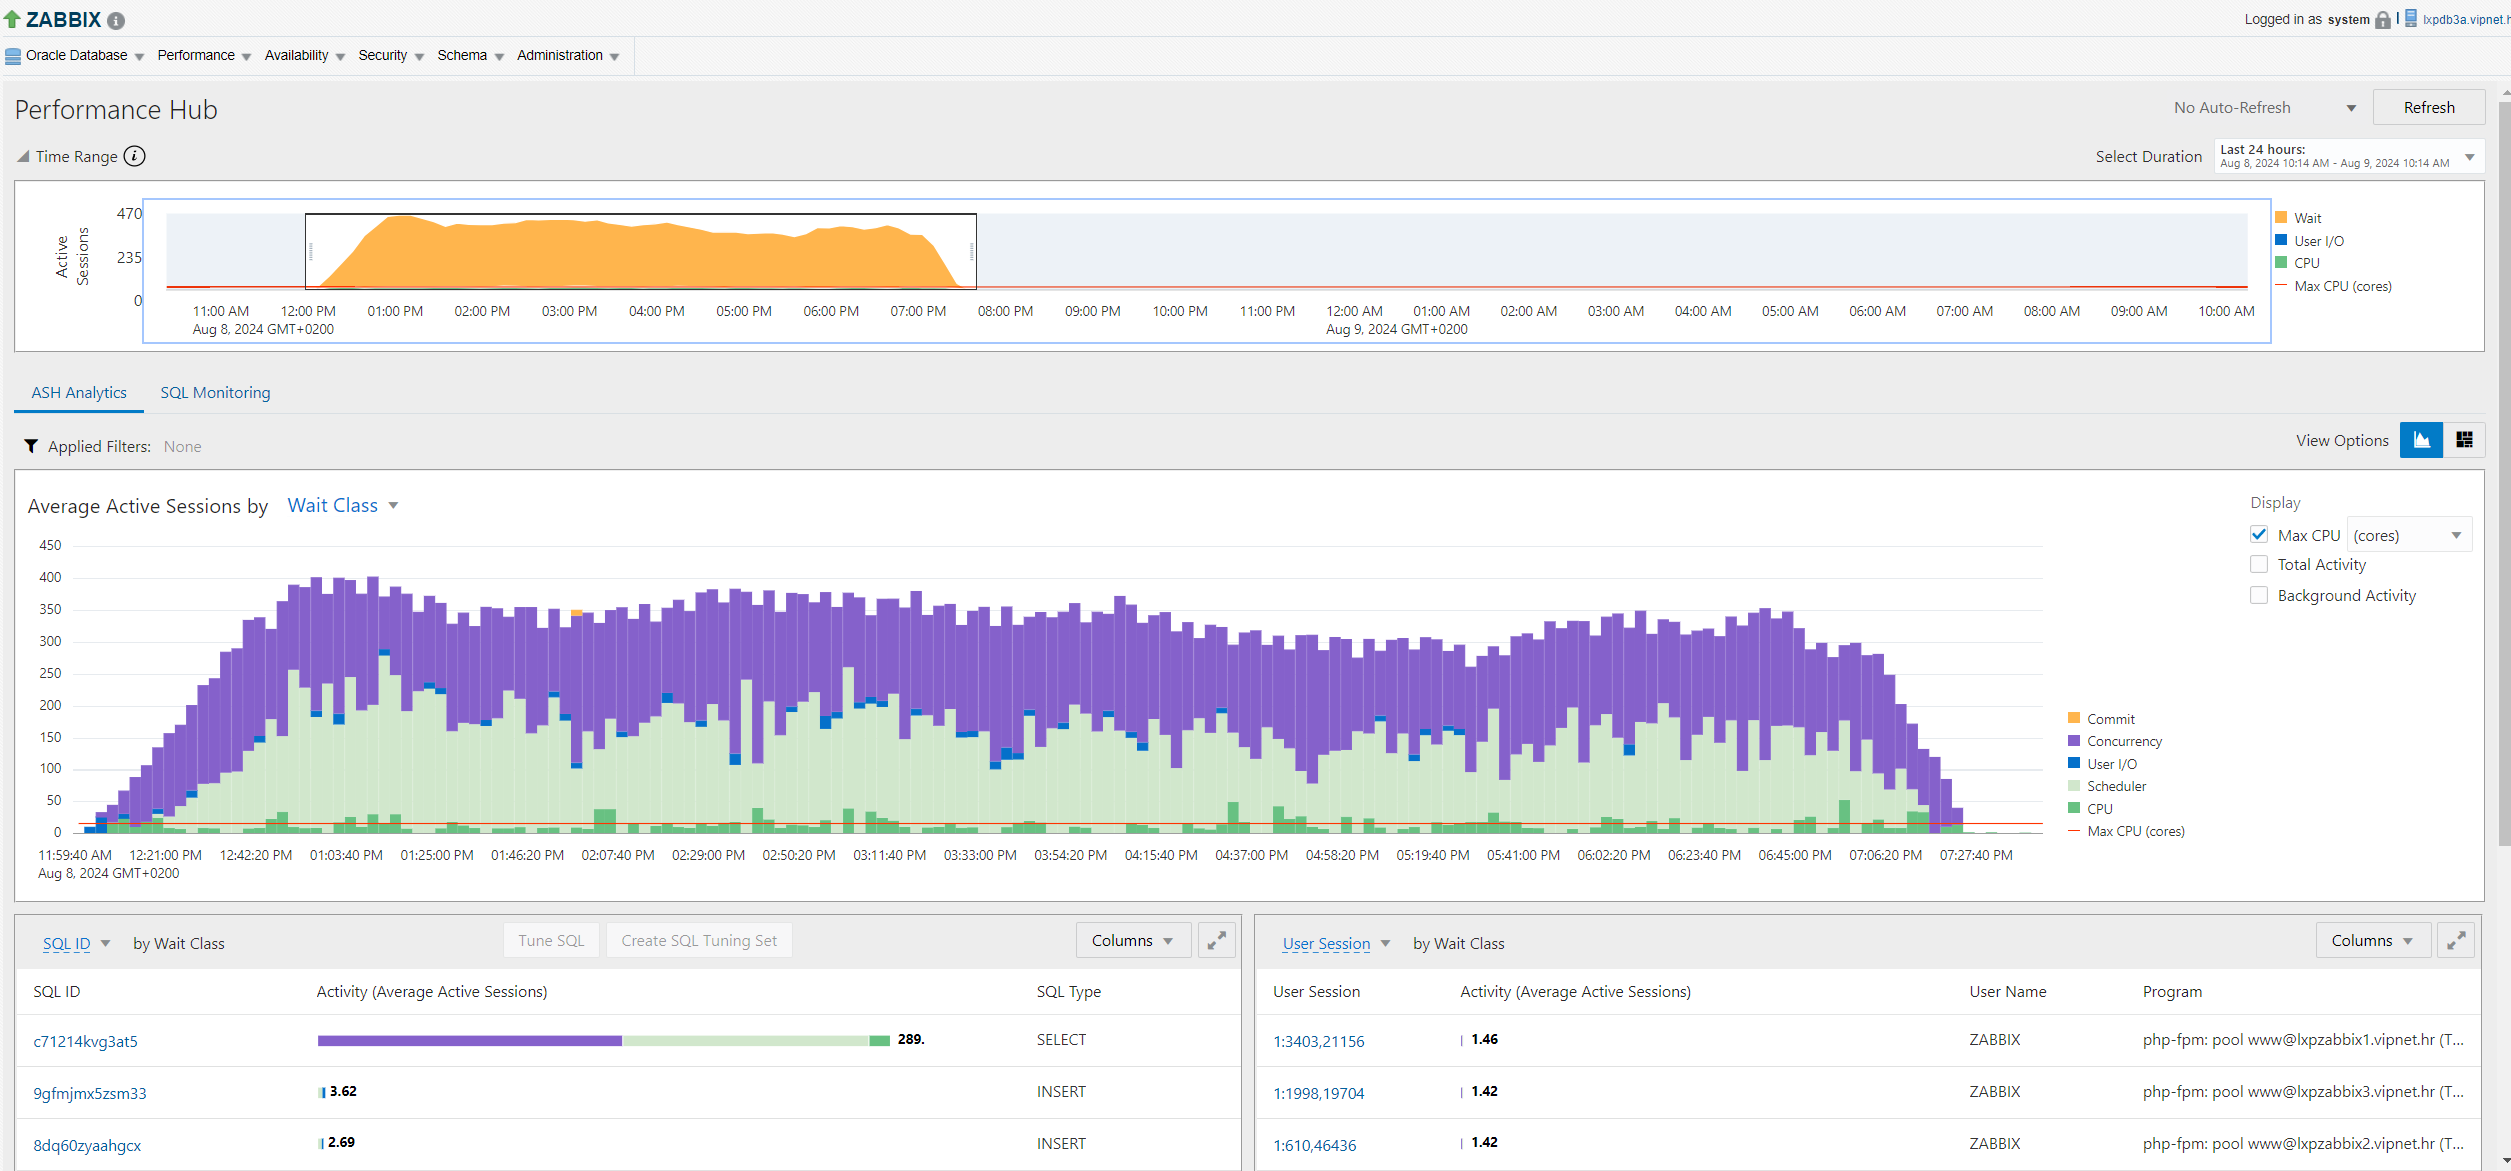
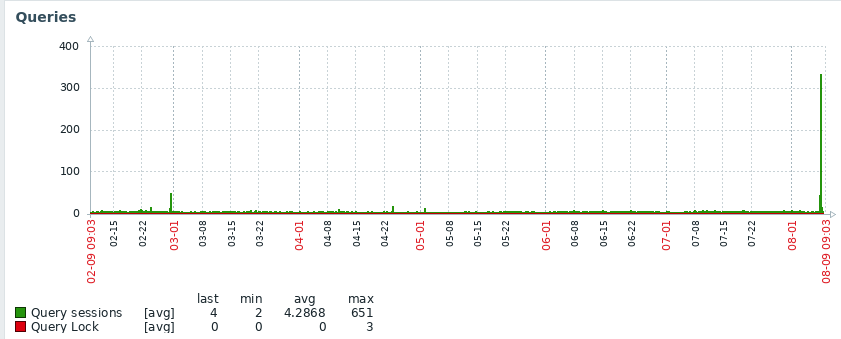
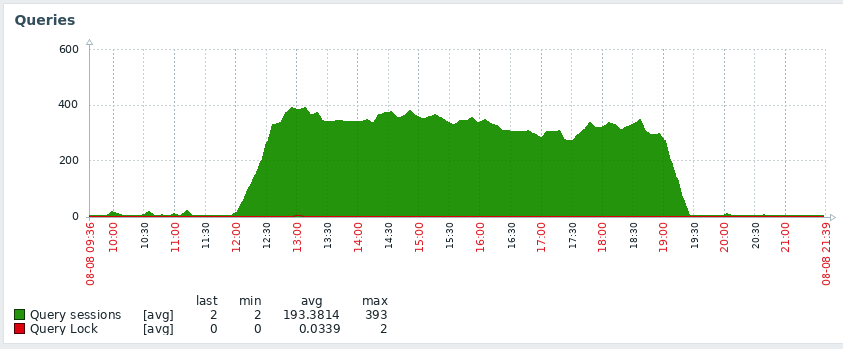
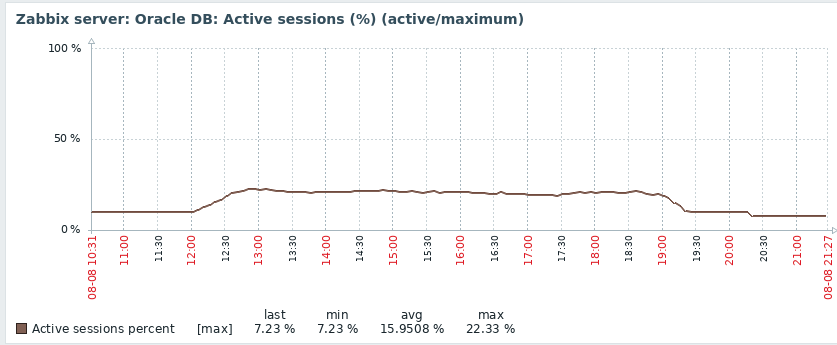
last Thursday (8.8.2024.) we encountered a problem with Zabbix 6.0.16, more precisely with its connections to the database. The number of connections suddenly increased around 12:00 and this lasted until 19:30.
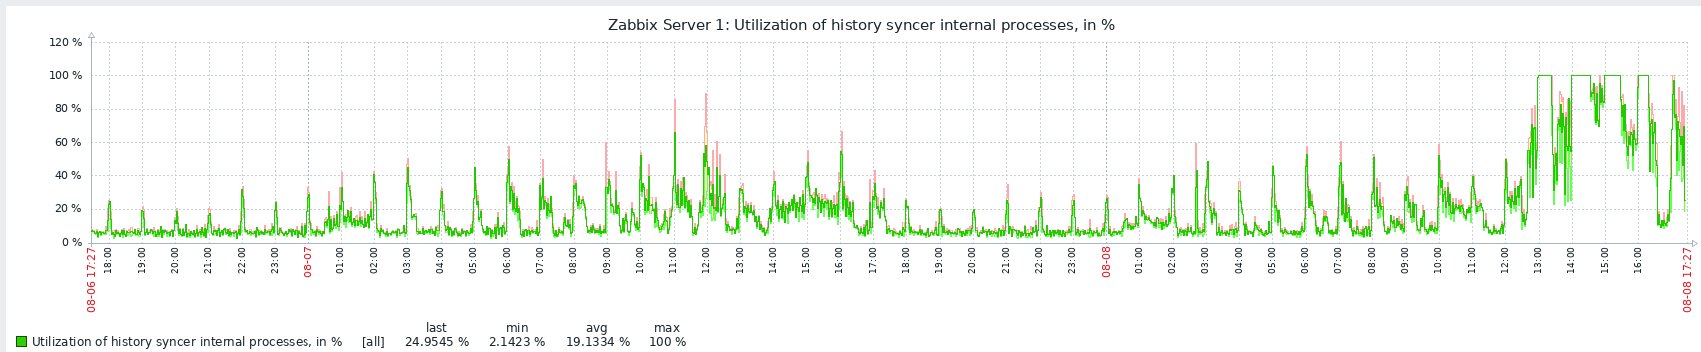
At the same time, history syncer alarms were created.
At the time of the problem, Zabbix GUI was unresponsive, slow,... Zabbix was unusable.
This query showed lots of db connections: SELECT COUNT![]() FROM V$SESSION WHERE STATUS = 'ACTIVE'; The number of connections was above 300.
FROM V$SESSION WHERE STATUS = 'ACTIVE'; The number of connections was above 300.
There was no increase in the number of monitored hosts a week before this incident.
Zabbix server OS: RHEL 8.9.
Db admins have checked the db at the time of the problem and found out that Zabbix created large number of db connections. They found this problematic query:
SELECT itemid,COUNT![]() AS count,AVG(value) AS avg,MIN(value) AS min,MAX(value) AS max,
AS count,AVG(value) AS avg,MIN(value) AS min,MAX(value) AS max,
round(:"SYS_B_00"* MOD(CAST(clock AS NUMBER(:"SYS_B_01"))+:"SYS_B_02",:"SYS_B_03")/(:"SYS_B_04"),:"SYS_B_05") AS i,MAX(clock) AS clock
FROM history_uint WHERE itemid=:"SYS_B_06" AND clock>=:"SYS_B_07" AND clock<=:"SYS_B_08"
GROUP BY itemid,round(:"SYS_B_09"* MOD(CAST(clock AS NUMBER(:"SYS_B_10"))+:"SYS_B_11",:"SYS_B_12")/(:"SYS_B_13"),:"SYS_B_14")
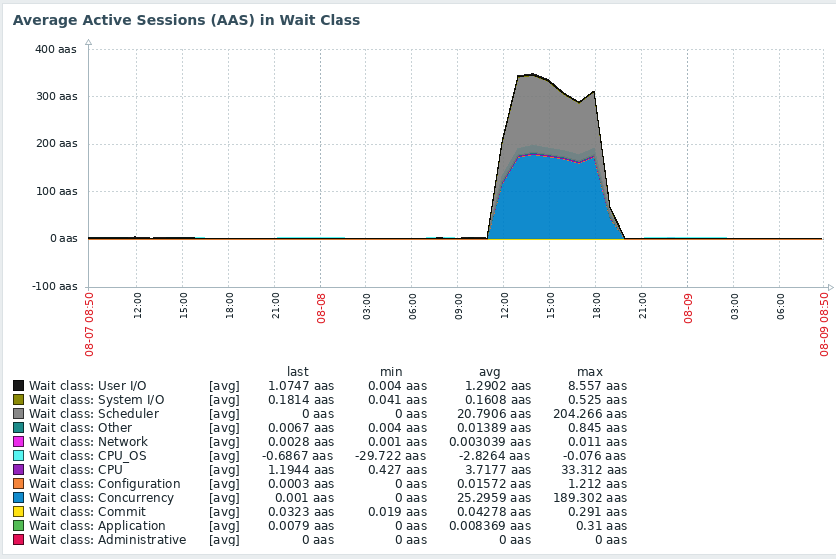
There were lots of these queries which resulted in db concurency locks, which hit the CPU limit and slowed the db down.
I'm attaching the graphs which show different metrics from the time of the problem, and also the Zabbix log.
Please help us find the cause of this problem so we can prevent it from happening in the future.
Regards, Omar