-
Type:
Problem report
-
Resolution: Fixed
-
Priority:
Trivial
-
Affects Version/s: 7.0.6, 7.2.0rc1
-
Component/s: Frontend (F)
-
S24-W48/49, S25-W8/9
-
3
Steps to reproduce:
- Send some multiple values to item at the same time (only nanoseconds differ) using command for ex:
 ./bin/zabbix_sender -z localhost -s HOST -k trap3 -o 15 &&
./bin/zabbix_sender -z localhost -s HOST -k trap3 -o 5 &&
./bin/zabbix_sender -z localhost -s HOST -k trap3 -o 10
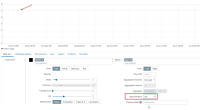
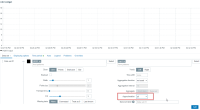
- Create a graph widget with this item in data set (use black color and 0 Transparency to see the dots sharply.
- Try Approximation functions min, max, avg and all.
Choose min, max, avg - dot is seen on the graph - EXPECTED

Choose approximation "all" - not any dot or line seen on the graph - NOT EXPECTED

Expected:
Line connecting from 5 to 15 seen on the graph, reflecting all values for the item received at that time point.
- is duplicated by
-
ZBX-25676 One metric is not displayed on the chart if the graph is stacked
-
- Closed
-
