-
Type:
Problem report
-
Resolution: Duplicate
-
Priority:
Trivial
-
None
-
Affects Version/s: 7.0.6
-
Component/s: Frontend (F)
-
None
-
Environment:Database server
OL8
Postgresql 14.3
Timescaledb 2.17.2
Zabbix server
OL8
Zabbix server 7.0.6
-
S25-W20/21
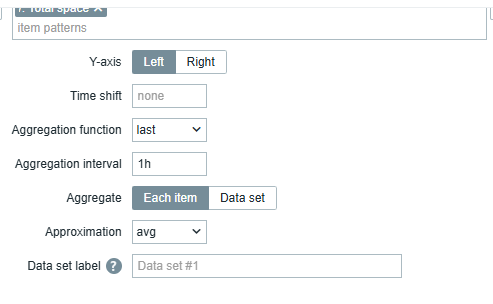
After upgrading zabbix from 6.4 .19 to 7.0.6, I have a problem with some of the charts. Displaying graphs (svgrapgh) with some aggregation options killed my database.
Steps to reproduce:
- Open graph or pie chart
- Set agregation function to last


Result:
Resource usage in the database increases dramatically (with temp_file_limit = -1 database may die), graph is not displayed
Problematic SQL query:
SELECT h.itemid, h.value, h.clock, s.tick
FROM history h
JOIN (
SELECT h2.itemid, h2.clock, MAX(h2.ns) AS ns, s2.tick
FROM history h2
JOIN (
SELECT itemid, CAST(clock AS BIGINT) - MOD(CAST(clock AS BIGINT), 3600) AS tick,
MAX(clock) AS clock
FROM history
WHERE itemid=49060
AND clock >= '1732875275' AND clock <= '1732878875'
GROUP BY itemid, CAST(clock AS BIGINT) - MOD(CAST(clock AS BIGINT), 3600)
) s2
ON h2.itemid = s2.itemid AND h2.clock = s2.clock
GROUP BY h2.itemid, h2.clock, s2.tick
) s
ON h.itemid = s.itemid AND h.clock = s.clock AND h.ns = s.ns;
In version 6.4.19, the SQL query for this aggregation had the following structure: no join operation was performed after the ns table. Introducing a join after ns results in a full table scan, as reflected in the query execution plan. In the case of TimescaleDB, this approach could lead to significant memory consumption—sometimes several gigabytes—and cause CPU usage to spike to 100%. Consequently, this made I/O-intensive operations more pronounced and observable.
– sql for this agregation in 6.4 without problems
SELECT DISTINCT h.itemid,h.value AS value,h.clock,hi.tick FROM history h JOIN(SELECT itemid, CAST(clock AS UNSIGNED)- MOD(CAST(clock AS UNSIGNED),3600) AS tick, MAX(clock) AS clock FROM history WHERE itemid=559684 AND clock>='1732488650' AND clock<='1733093450' GROUP BY itemid, CAST(clock AS UNSIGNED)- MOD(CAST(clock AS UNSIGNED),3600)) hi ON h.itemid = hi.itemid AND h.clock = hi.clock
- is duplicated by
-
ZBX-26372 Querying some latest data causes chunk decompression for all records in historical tables
-
- Closed
-

