-
Type:
Problem report
-
Resolution: Fixed
-
Priority:
Trivial
-
Affects Version/s: 7.0.6
-
Component/s: Frontend (F)
-
Environment:SLES 15 sp6, PostgreSQL 16, Zabbix server v7.0.6 compiled from sources
-
S25-W4/5, S25-W6/7, S25-W8/9, S25-W10/11
-
1
Steps to reproduce:
- Have some host with several classic graphs made from prototypes created by an LLD (for example, for traffic on network switch interfaces, or for space usage on mounted volumes);
- Navigate to: Monitoring -> Hosts -> "Graphs" link against the host;
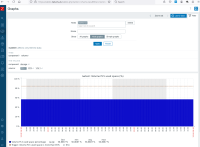
- On the "Filter" tab: make sure that you can see the tags generated for each entity (interface or volume); click on the tag for the first volume (for example) and see that this only volume is filtered now - it is OK (screenshot screenshot-2024-12-04_01.PNG);
- Then click on the tag for some another volume and see the result.
Result:
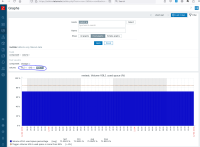
Only this another volume is filtered out now (see screenshot screenshot-2024-12-04_02.PNG).
Expected:
Both tag values should be selected together, and graphs for 2 volumes should be displayed.
According to the documentation:
When a tag name/value is clicked, it is highlighted with a gray background, and graphs are immediately filtered (no need to click Apply in the main filter). Clicking another tag name/value adds it to the filtered results. Clicking the tag name/value again removes the filtering.
Additional info:
The similar subfilter is present on some other pages, too; for example - "Latest data". Its description in documentation is identical to the subfilter description for the "Graphs" page; however, the "Latest data" page subfilter works according to this description (it allows to select multiple values for the same tag).
Version 6.0 also did not have this problem.
- caused by
-
ZBX-24052 Error when applying subfilter by tag on graph page if item tag contains special characters
-
- Closed
-


