-
Type:
Problem report
-
Resolution: Fixed
-
Priority:
Major
-
Affects Version/s: 7.2.1rc1, 7.4.0alpha1
-
Component/s: Frontend (F)
-
Prev.Sprint, S25-W36/37, S25-W40/41, S25-W42/43, S25-W44/45
-
2
Steps to reproduce:
- Create host with name aa and with trapper item (key->trap) or use import file: zbx-25761.yaml

- create input file with data (time period from Sun Dec 15 2024 11:59:59 =>13:00:01 GMT+0000)
aa trap 1734263999 1
aa trap 1734264000 1
aa trap 1734264001 1
aa trap 1734267599 1
aa trap 1734267600 1
aa trap 1734267601 1
- Run server and execute sender command =>
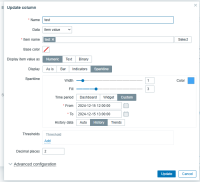
./bin/zabbix_sender -vv -z "localhost" -T -i input - Create dashboard with item value widget and configuration: sparkline, 'History data => History' and time period from: 2024-12-15 12:00:00 to: 2024-12-15 13:00:00
e.g.
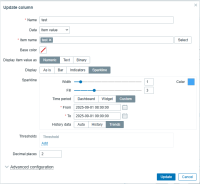
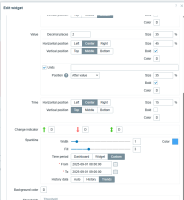
- Create top hosts widget with sparkline, 'History data => History' and time period from: 2024-12-15 12:00:00 to: 2024-12-15 13:00:00
e.g.
- Compare widgets
Result: Top hosts widget doesn't show sparkline chart. Sparkline chart appears only after adding aggregation function with same time period or changing GUI param 'Max history display period' (if time period fits display period range).

Note: the same issue appears in case of Trends. Change History data => Trends for both widgets and compare results
Expected: Top hosts should show sparkline chart.
- caused by
-
ZBXNEXT-9232 Enhance visibility with Sparkline charts in Zabbix
-
- Closed
-


