-
Type:
Problem report
-
Resolution: Fixed
-
Priority:
 Major
Major
-
Affects Version/s: 6.0.37, 7.0.7, 7.2.2
-
Component/s: Templates (T)
-
Support backlog
-
2
Steps to reproduce:
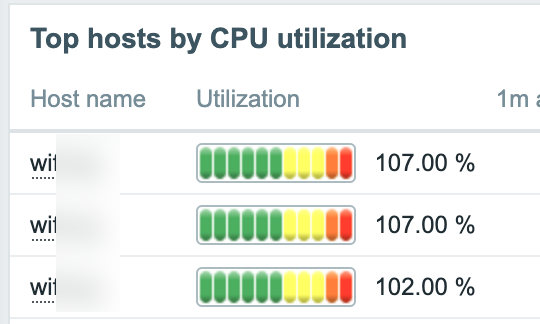
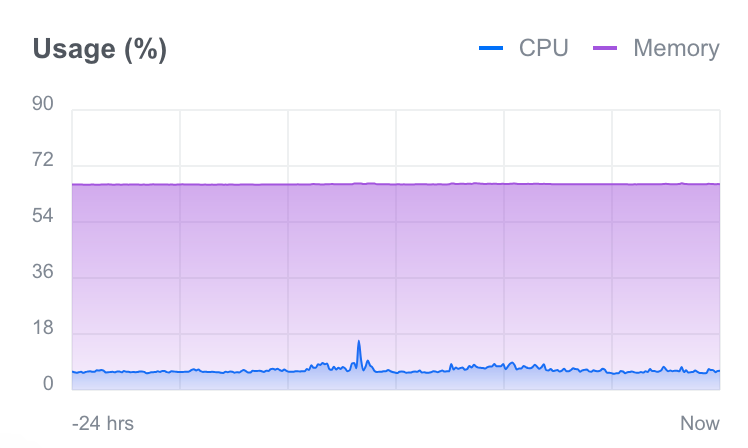
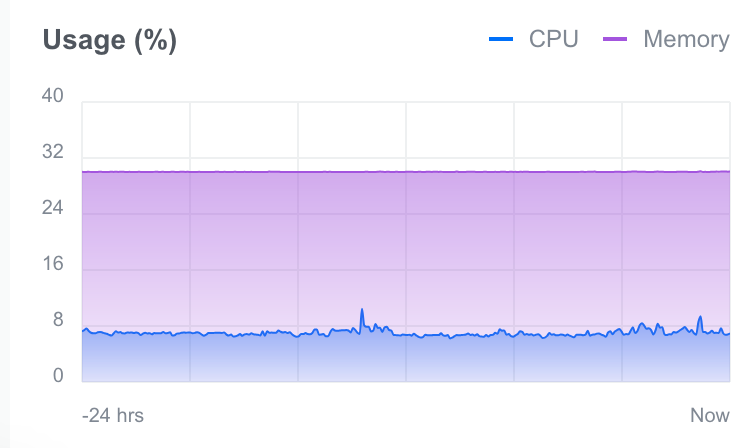
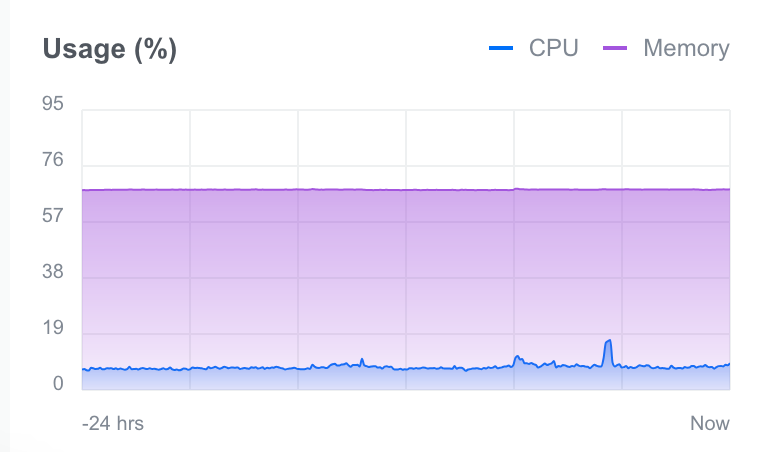
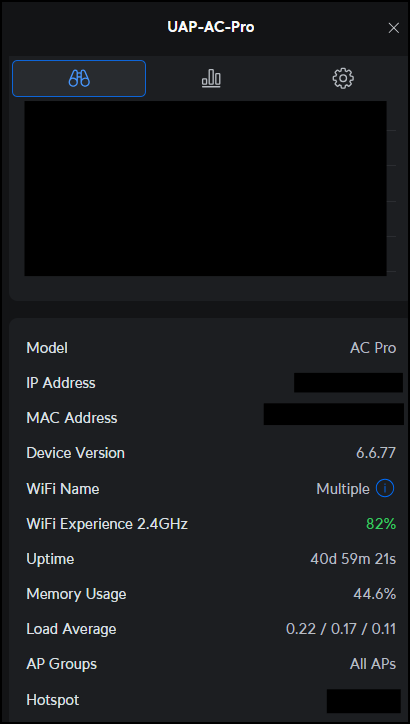
- I was checking some triggers about CPU Utilization in some Ubiquiti AP's (U6-Lite and UAP-AP-PRO).
- My first impression is about the real utilization of the AP, and I check that the AP has 3 connections of som IoT devices, so the utilization should be almost zero.
- So, I've checked the CPU in Unifi website, but only shows CPU Load. (And obviuosly is not the same than CPU Utilization)
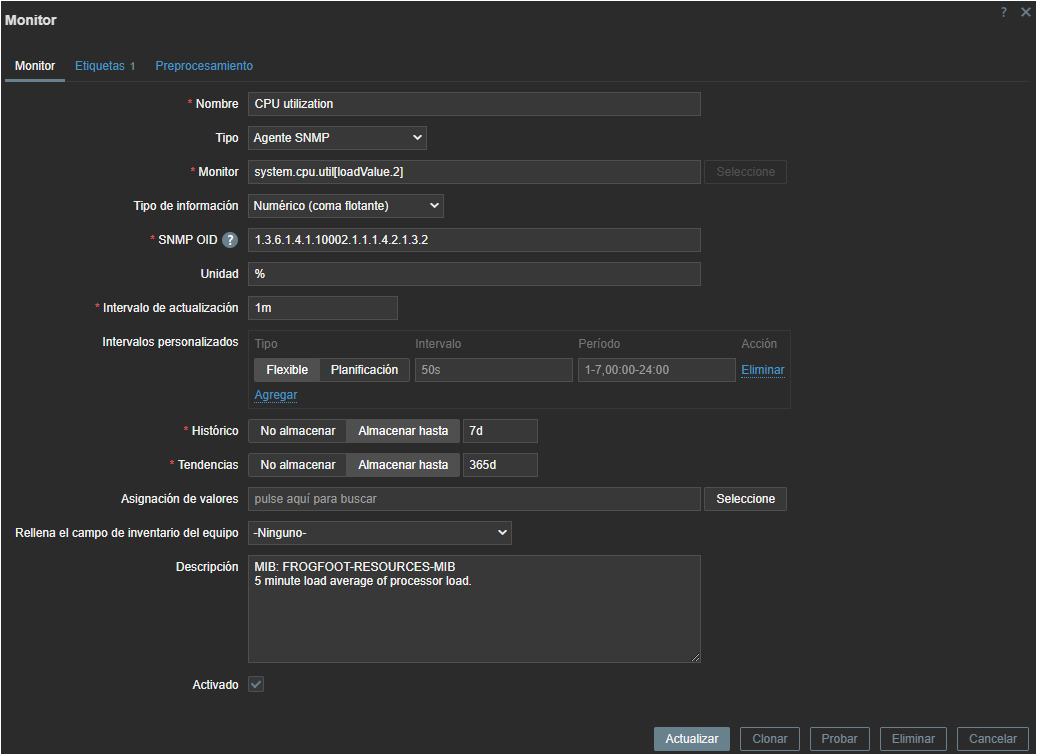
- So I check the template settings of monitors and I see this:
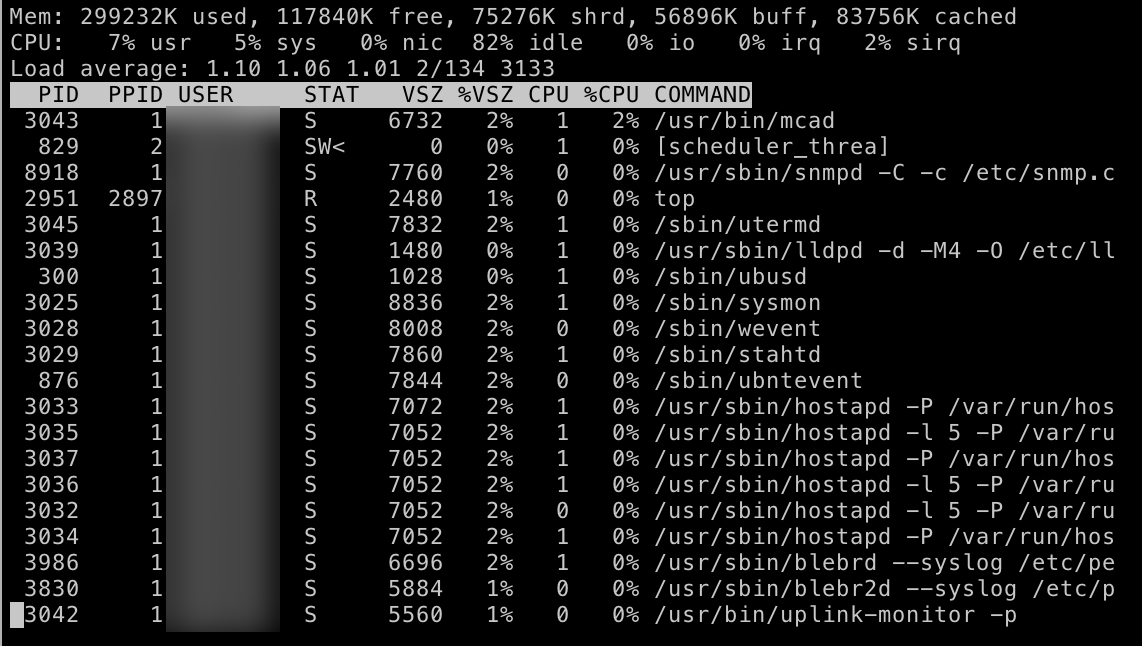
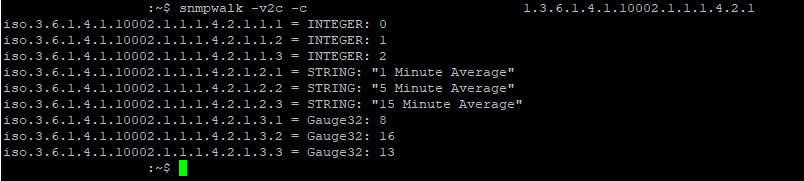
- Monitor: system.cpu.util[loadValue.2]
- SNMP OID: 1.3.6.1.4.1.10002.1.1.1.4.2.1.3.2
- Next, I've check the OID:
- snmpwalk -v2c -c {SNMP_COMMUNITY} [IP_ADDRESS_AP] 1.3.6.1.4.1.10002.1.1.1.4.2.1
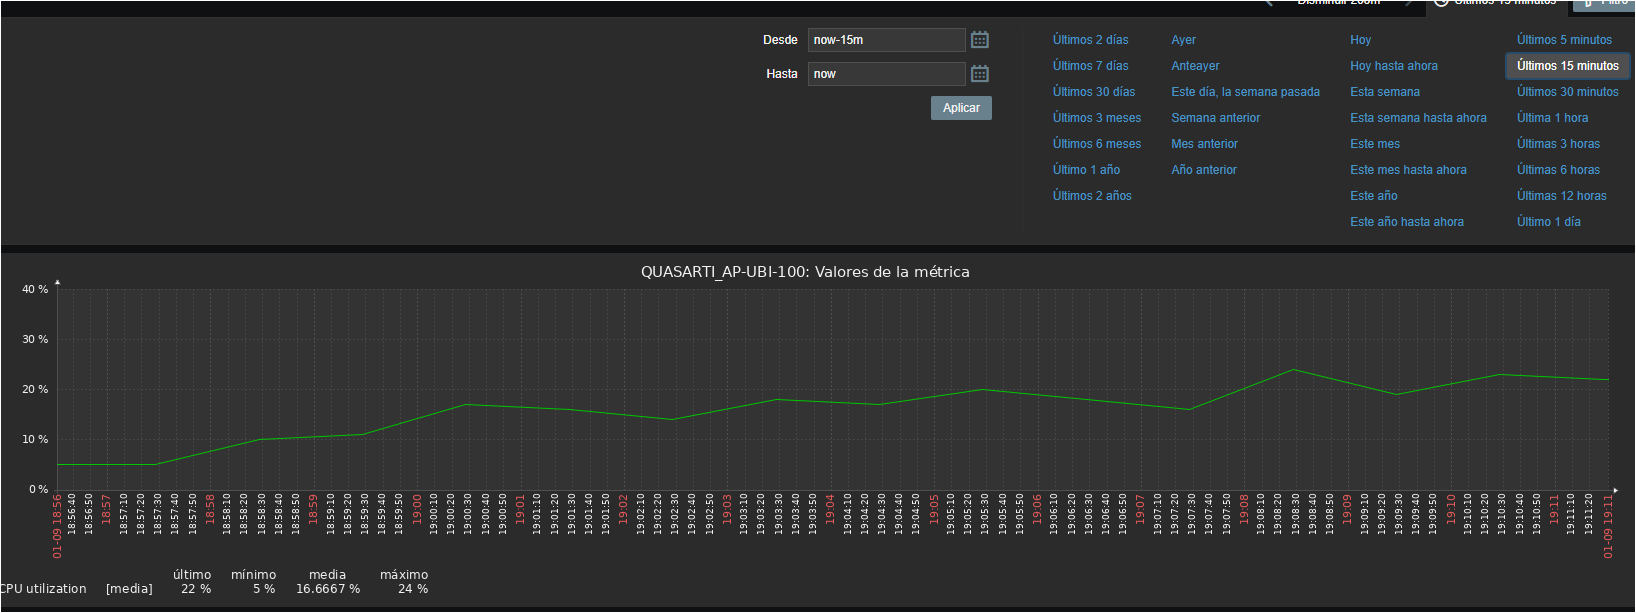
- And the result is equal to load in the Unifi Website.
- I can't find any other value and information about CPU Utilization in the OIDs of the APs.
- So, the problem is that Load is not the same than Utilization, and the value is not processed in a right way, creating confusion and false positive triggers about this.
- Ironically, the description of the monitor says perfectly that the information is CPU Load.
Result:
Wrong data is collected. Load is not the same than CPU Utilization.
I was checking that this bug exists in other forums, but the technicians point to triggers, and sorry but they are wrong to point that, because is not the cause of the issue:
https://support.zabbix.com/si/jira.issueviews:issue-html/ZBX-24098/ZBX-24098.html
If this is corrected, the actual template is not updated:
Expected:
Is expected that:
- The information that Zabbix gets should be really a utilization percentage of cycles.
- Or modify the monitor to indicate that data is about Load (processes) and consecuently correcting the triggers related to.