-
Type:
Problem report
-
Resolution: Won't fix
-
Priority:
 Minor
Minor
-
None
-
Affects Version/s: 7.0.9
-
Component/s: Frontend (F)
-
None
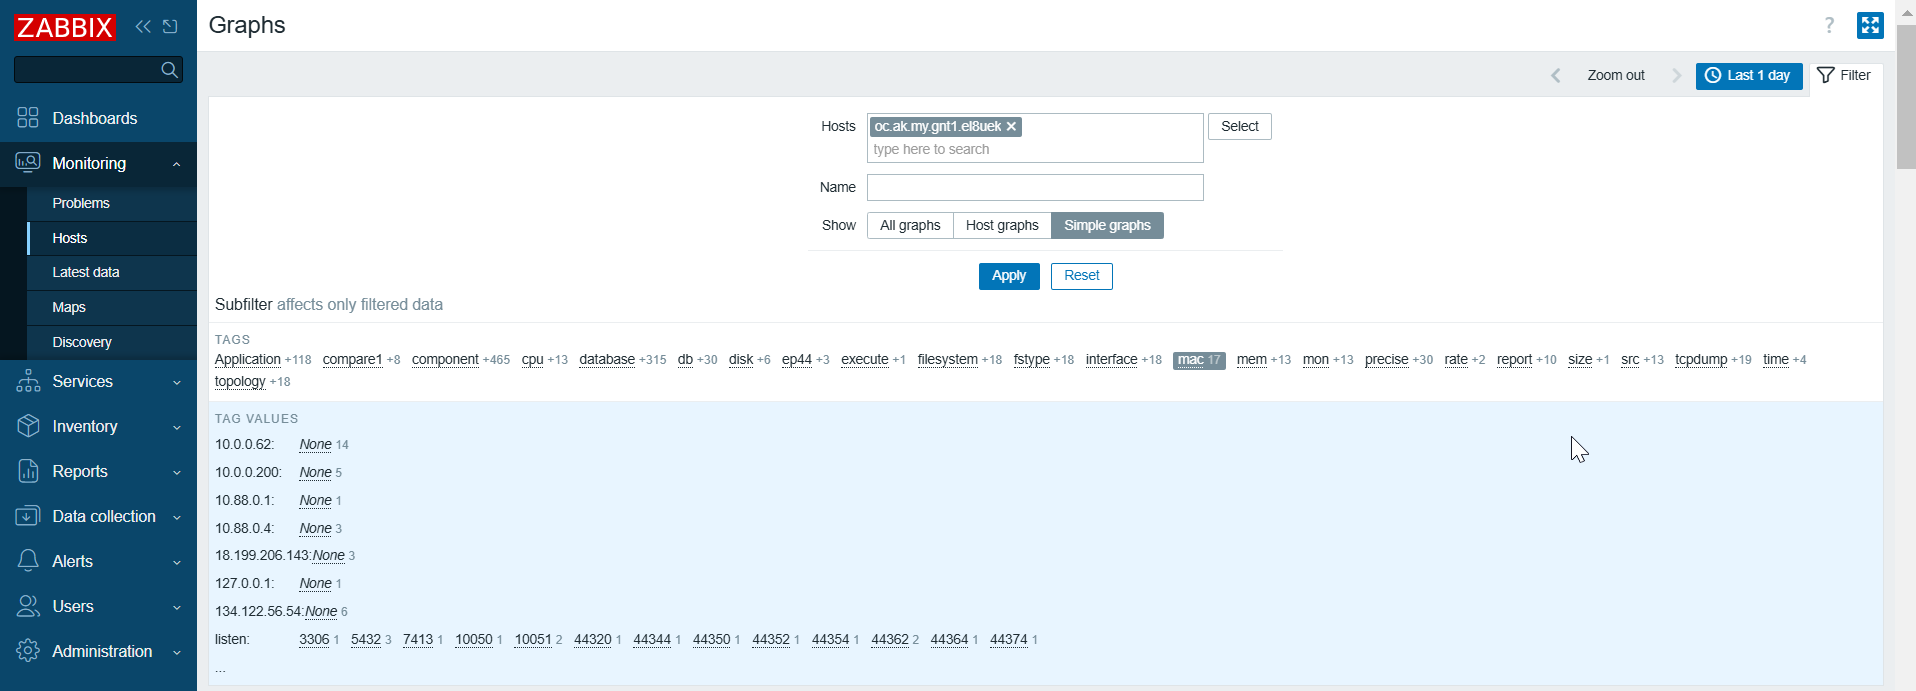
The section "Monitoring" => "Hosts" => "Graphs" => "Filter" => "Simple graph" generates a graph for every numerical data point. The screen offers many tags (and tag values) as a navigation.
It's not possible to expand the list in full:
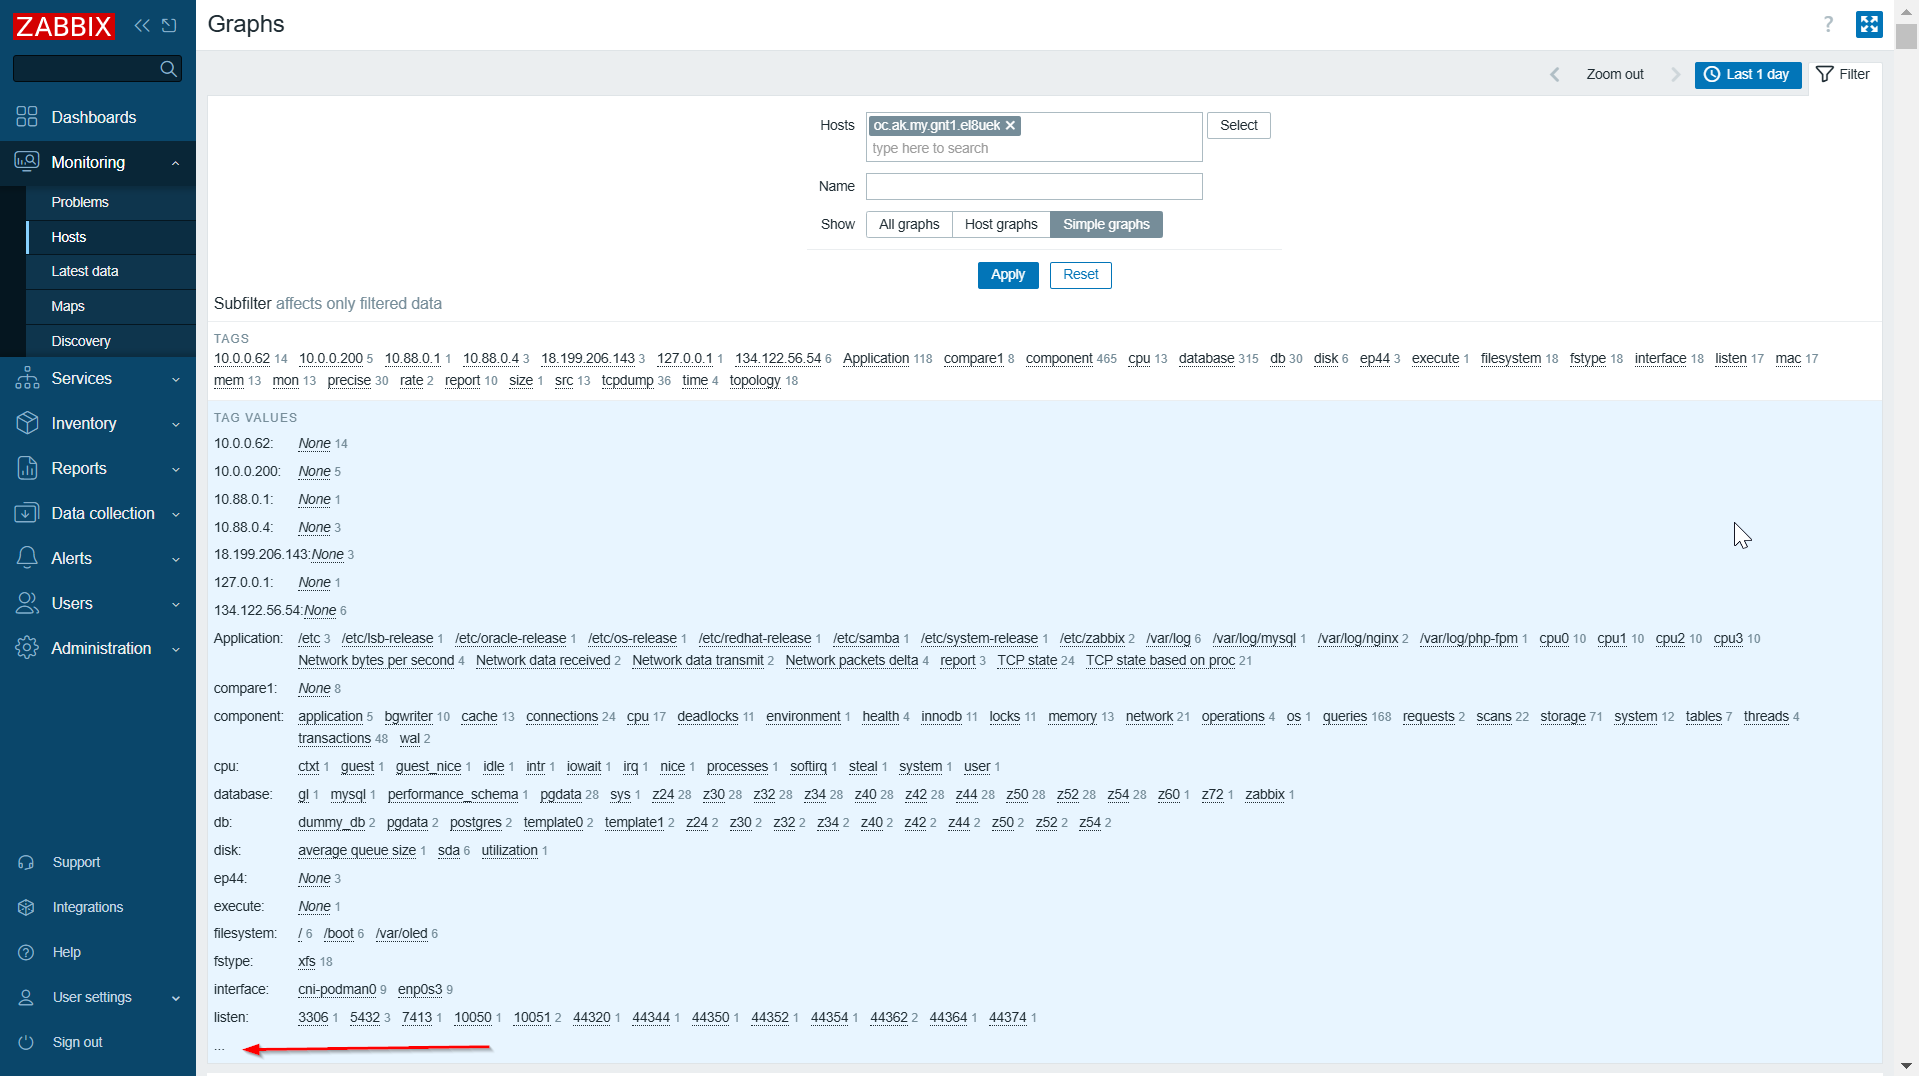
A workaround to select only the tag name (selecting "mac" in the example) also not reveal all tag values (17 different tag values in example):

The include/defines.inc.php file already contains:
define('SUBFILTER_VALUES_PER_GROUP', 1000);
Switching to 10000 does not help.