-
Type:
Problem report
-
Resolution: Done
-
Priority:
 Trivial
-
None
-
Affects Version/s: 7.0.10, 7.2.4
-
Component/s: Server (S)
Good day!
We are currently migrating from Zabbix version 4.4.5 (from source) with Oracle DB to the new version Zabbix 7.0 with PostgreSQL (with the TimescaleDB plugin).
We have transferred all hosts and compared the old and new templates. However, we encountered a specific issue with excessive RAM consumption.
Let me explain step by step.
- Server configuration:
- zabbix_server and zabbix_web are deployed on the same server running Oracle Linux Server 9.5
(Kernel: Linux 5.15.0-306.177.4.el9uek.x86_64),
initially with 32 GB of RAM and 8 CPU cores.
- PostgreSQL is running on a separate server with Oracle Linux Server 9.4
(Kernel: Linux 5.15.0-209.161.7.1.el9uek.x86_64),
with 24 GB of RAM and 8 CPU cores.
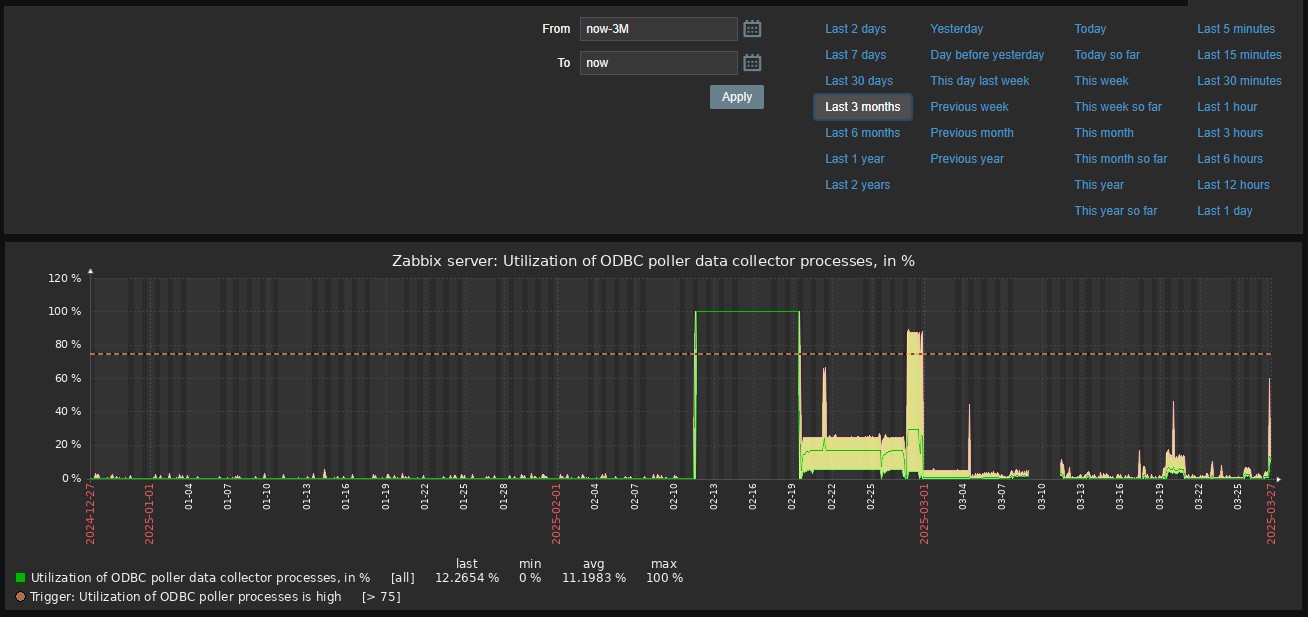
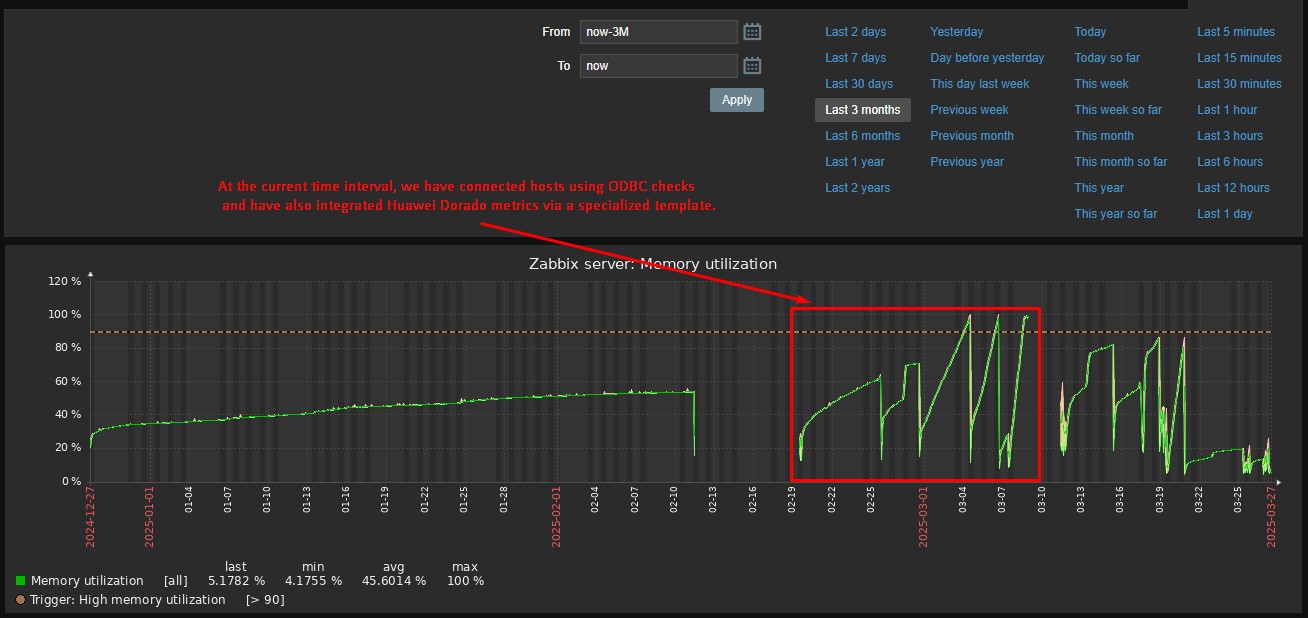
We encountered an issue with excessive memory consumption after configuring templates and activating the ODBC templates, as well as enabling Huawei Dorado hosts with the Huawei OceanStor 5300 V5 by SNMP template.
Initially, we increased the number of pollers and unreachable pollers since their load was quite high.
We also upgraded to Zabbix version 7.0.10, and then further to 7.2.4, but unfortunately, this did not help.
We tried adjusting the number of pollers, but unfortunately, it did not yield the desired results.
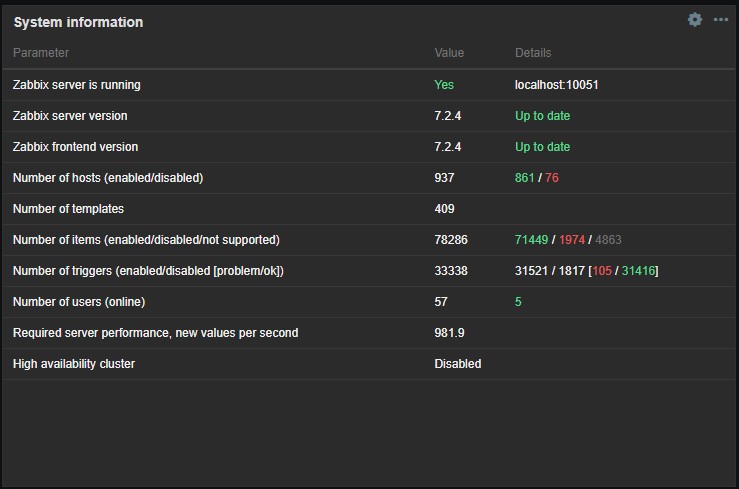
Below is the system information see screenshot sytem_ifo.jpg.
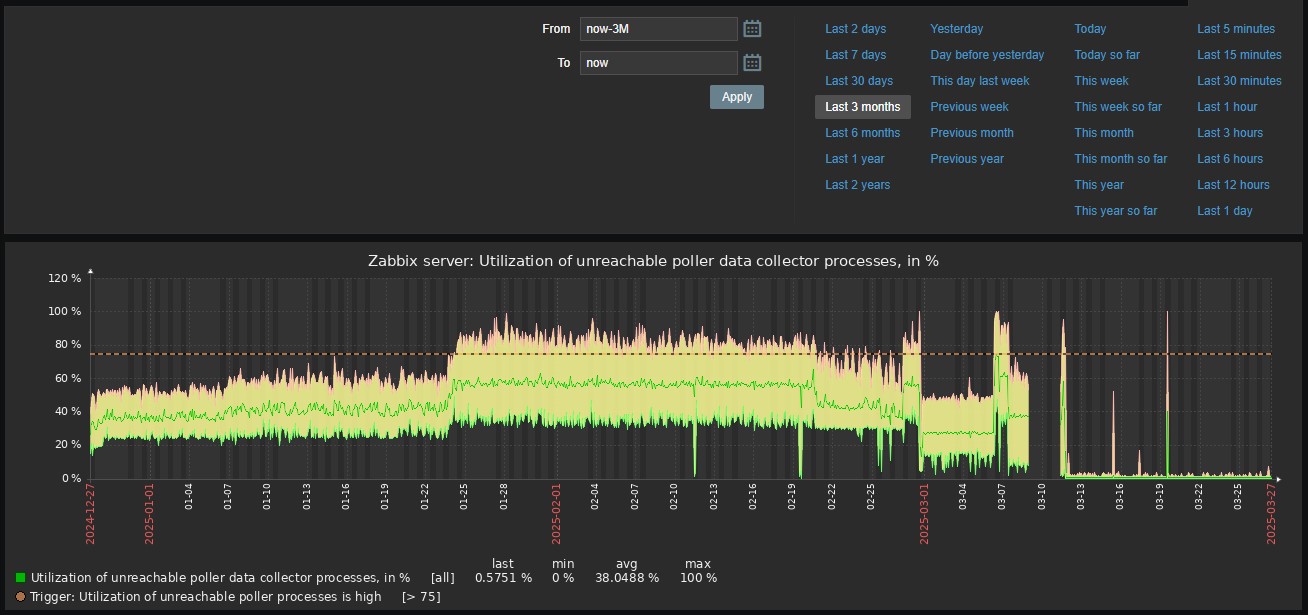
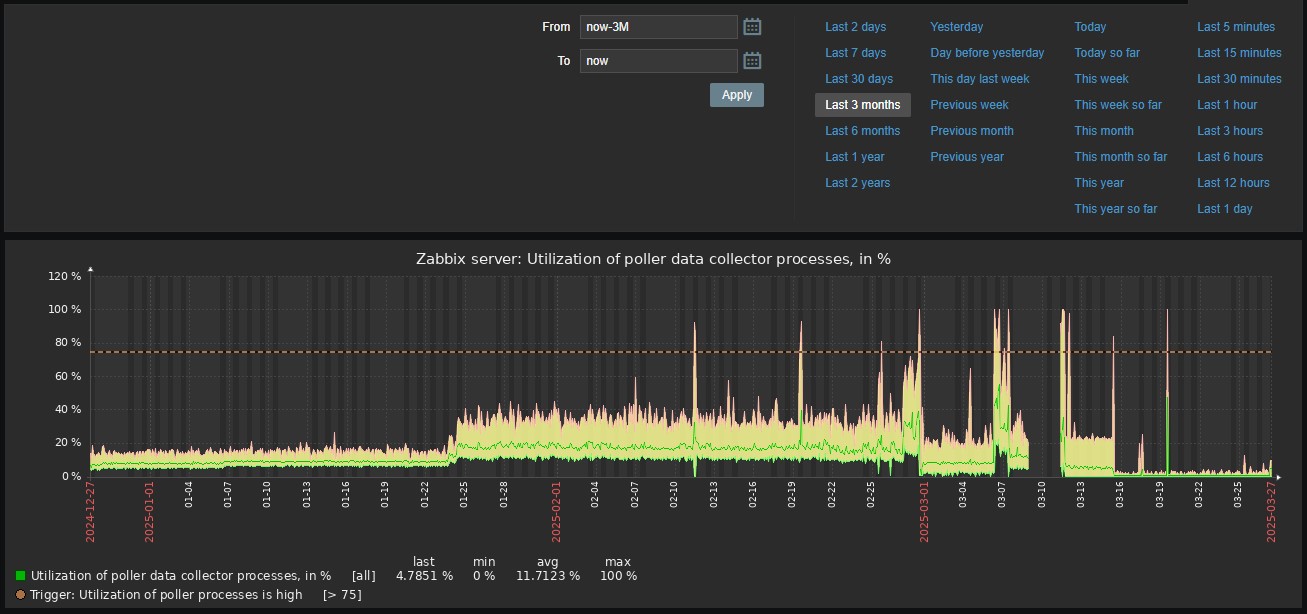
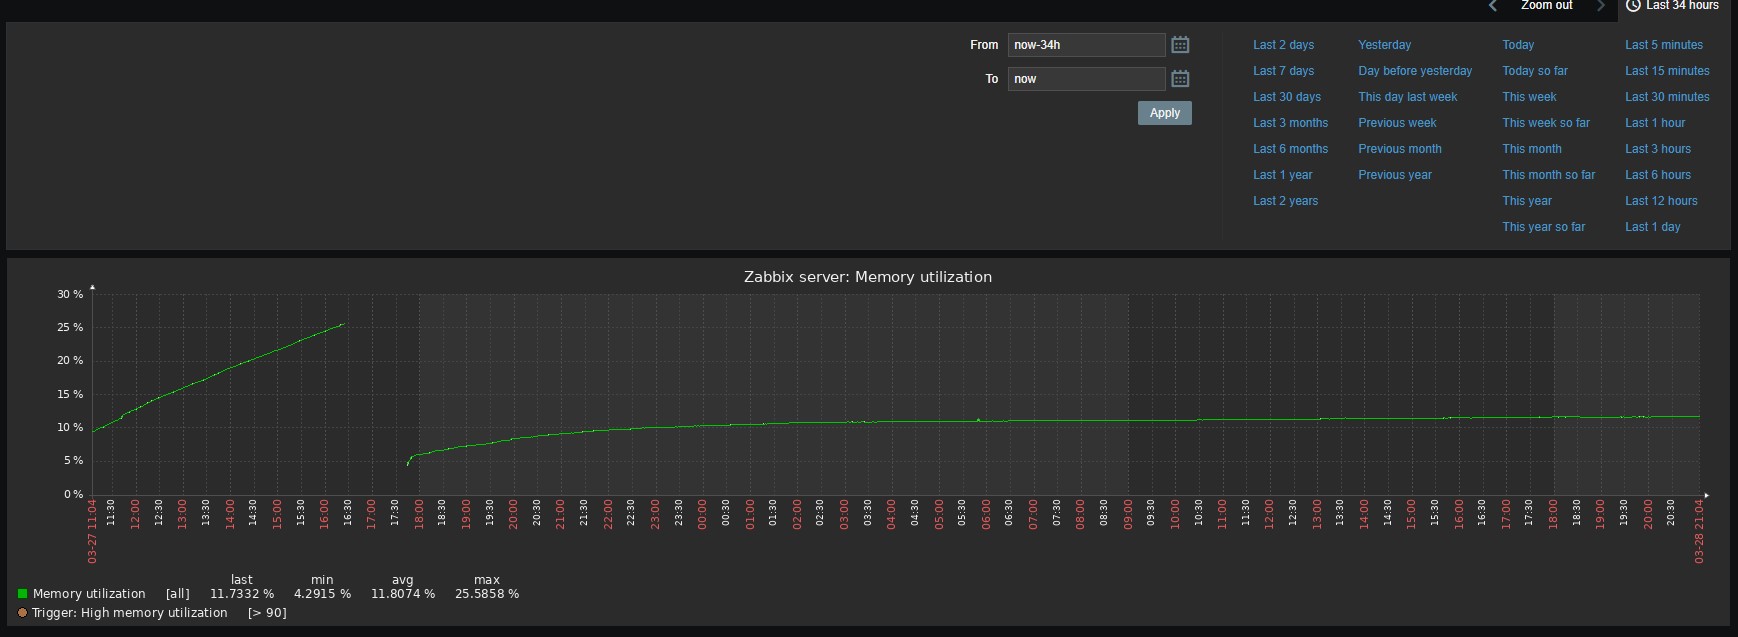
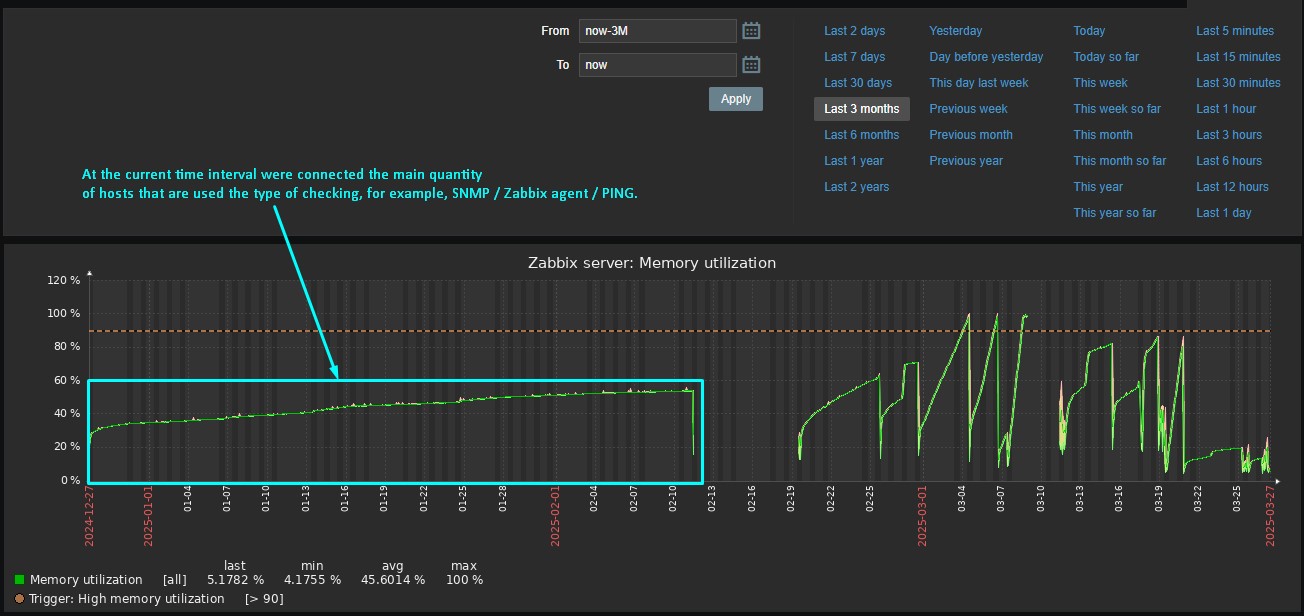
Attached are screenshots showing memory usage before enabling hosts with ODBC polling type and hosts using the Huawei OceanStor 5300 V5 by SNMP template.
The screenshots also include information on the utilization of main pollers and unreachable pollers.
Additionally, the attached files contain the Zabbix server configuration file and the output of the zabbix_server -R diaginfo command.
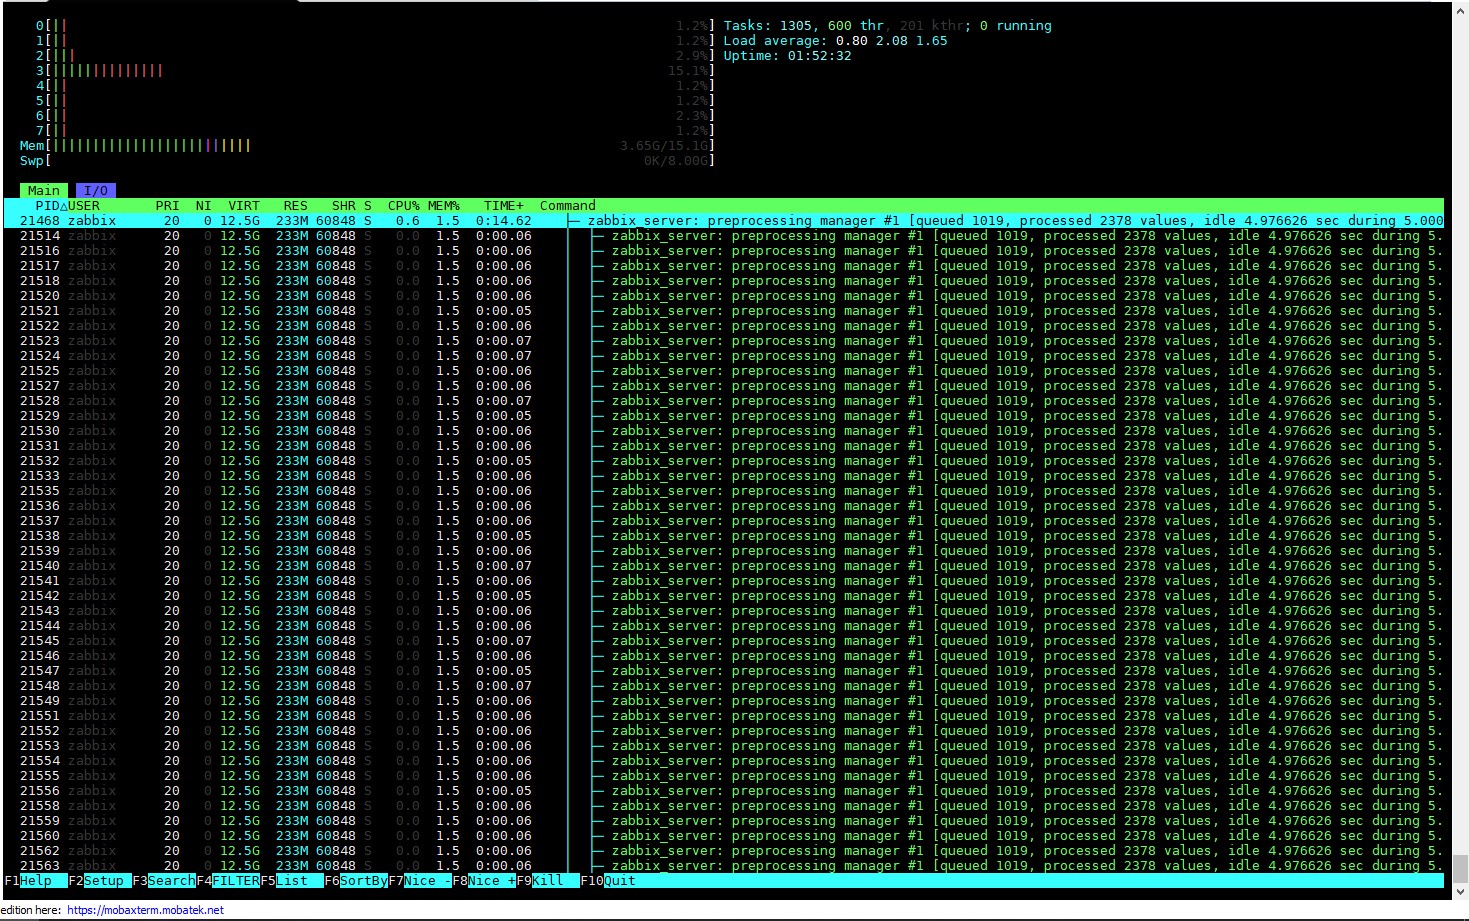
There is also a screenshot of the htop command attached, which shows that the Preprocessing Manager is holding 1,000 items in the queue and has over 2,000 items processed.
Additionally, after disabling the aforementioned hosts, memory is not being released.