-
Type:
Problem report
-
Resolution: Fixed
-
Priority:
 Blocker
-
Affects Version/s: 7.2.4
-
Component/s: Agent2 (G)
-
Environment:root@zabbix-proxy-2 [~] # cat /etc/redhat-release
Red Hat Enterprise Linux release 8.10 (Ootpa)
root@zabbix-proxy-2 [~] # zabbix_agent2 --version
zabbix_agent2 (Zabbix) 7.2.4
Revision c34078a4563 25 February 2025, compilation time: Feb 25 2025 10:29:03, built with: go1.23.4
Plugin communication protocol version is 6.4.0
root@zabbix-proxy-2 [~] # cat /etc/redhat-release
Red Hat Enterprise Linux release 8.10 (Ootpa)root@zabbix-proxy-2 [~] # cat /etc/redhat-release Red Hat Enterprise Linux release 8.10 (Ootpa) root@zabbix-proxy-2 [~] # zabbix_agent2 --version zabbix_agent2 (Zabbix) 7.2.4 Revision c34078a4563 25 February 2025, compilation time: Feb 25 2025 10:29:03, built with: go1.23.4 Plugin communication protocol version is 6.4.0 root@zabbix-proxy-2 [~] # cat /etc/redhat-release Red Hat Enterprise Linux release 8.10 (Ootpa)
-
Prev.Sprint, S26-W04/05
-
2
Steps to reproduce:
- Fresh installation of zabbix-agent2 on RedHat 8.10 host
- Use Oracle template by Zabbix agent 2 (Vendor and version: Zabbix, 7.2-1) for multiple (about 90) remote Oracle database instances. The agent cannot be installed on remote hosts with databases, therefore an external host with zabbix-agent2 is used.
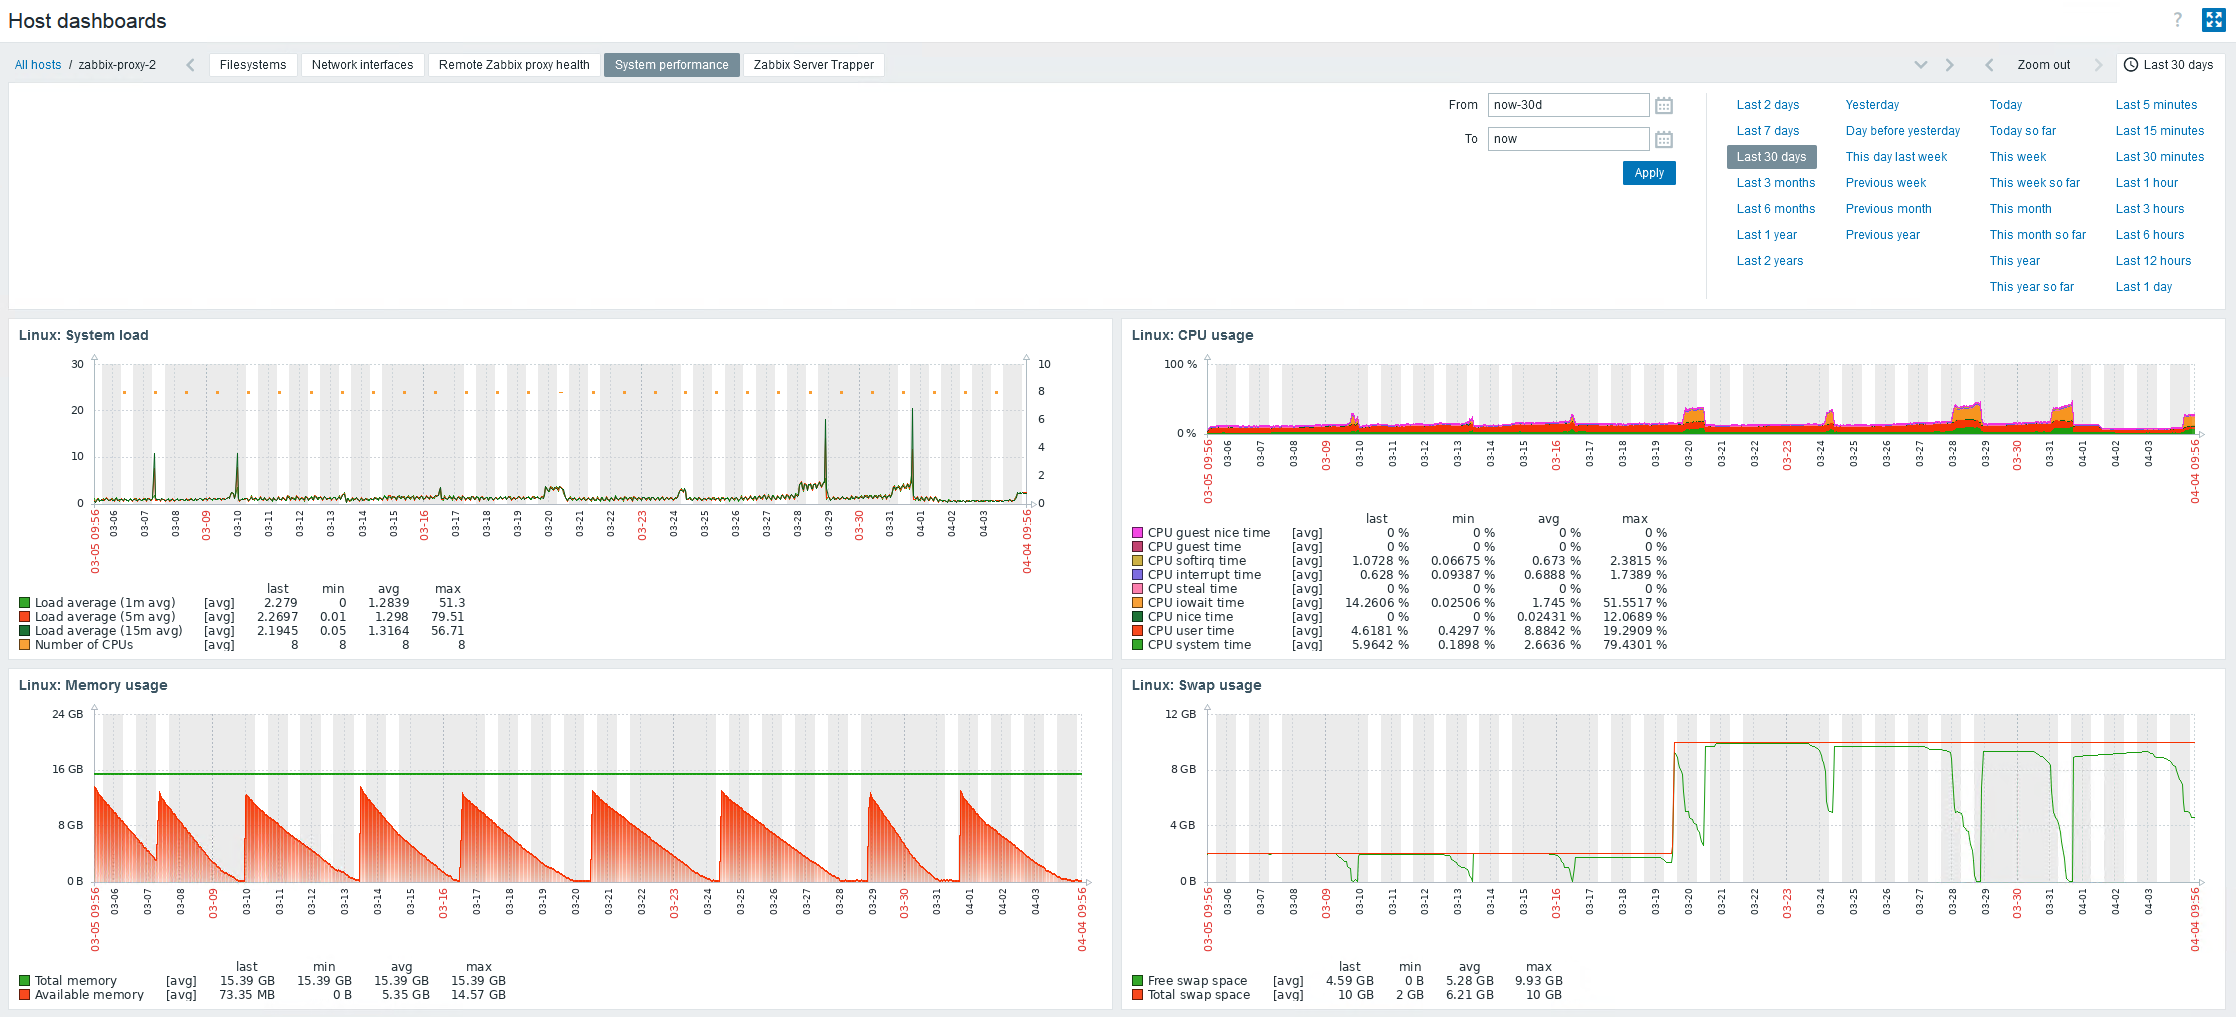
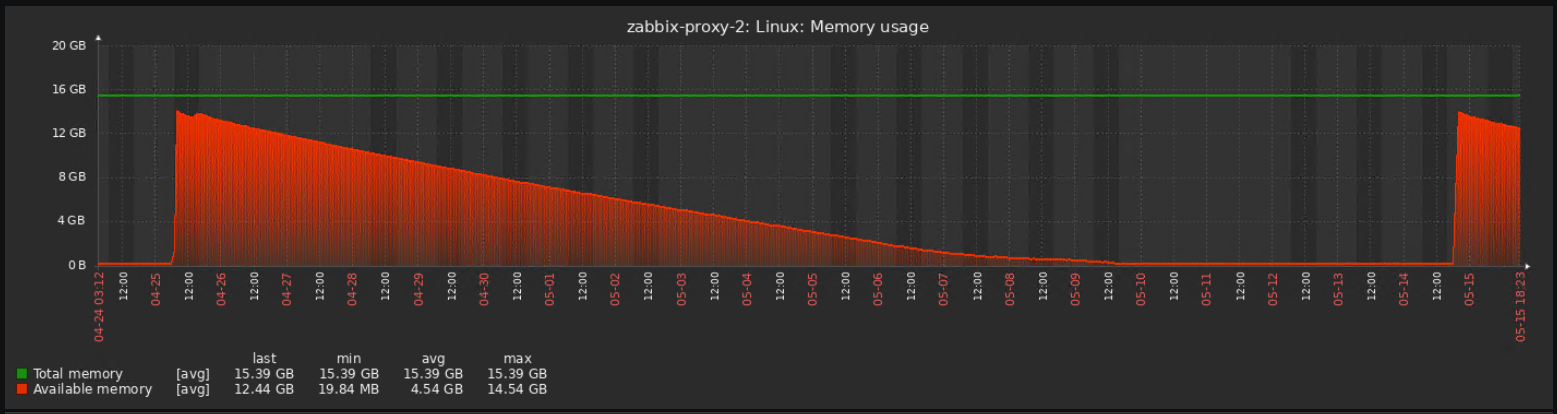
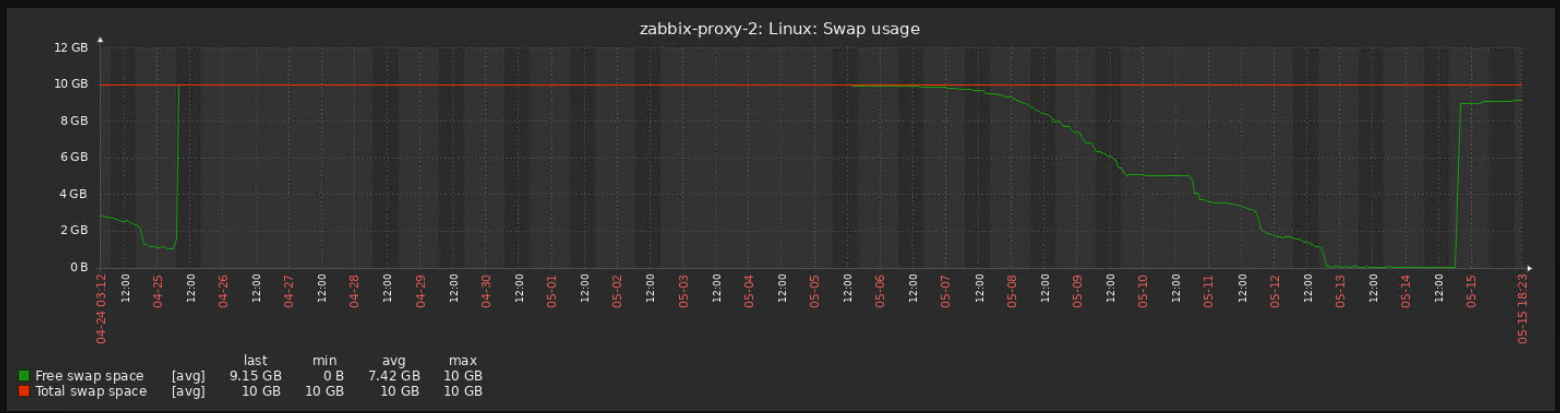
- After a few days, all RAM and SWAP is consumed by zabbix-agent2.
Let me just add that test on the same host we have additionally launched the agent gen.1 (also v.7.2.4, works on the standard port 10050, agent2 operates with us on port 20050) to monitor oracla through ODBC and there are no problems with it.
Result:
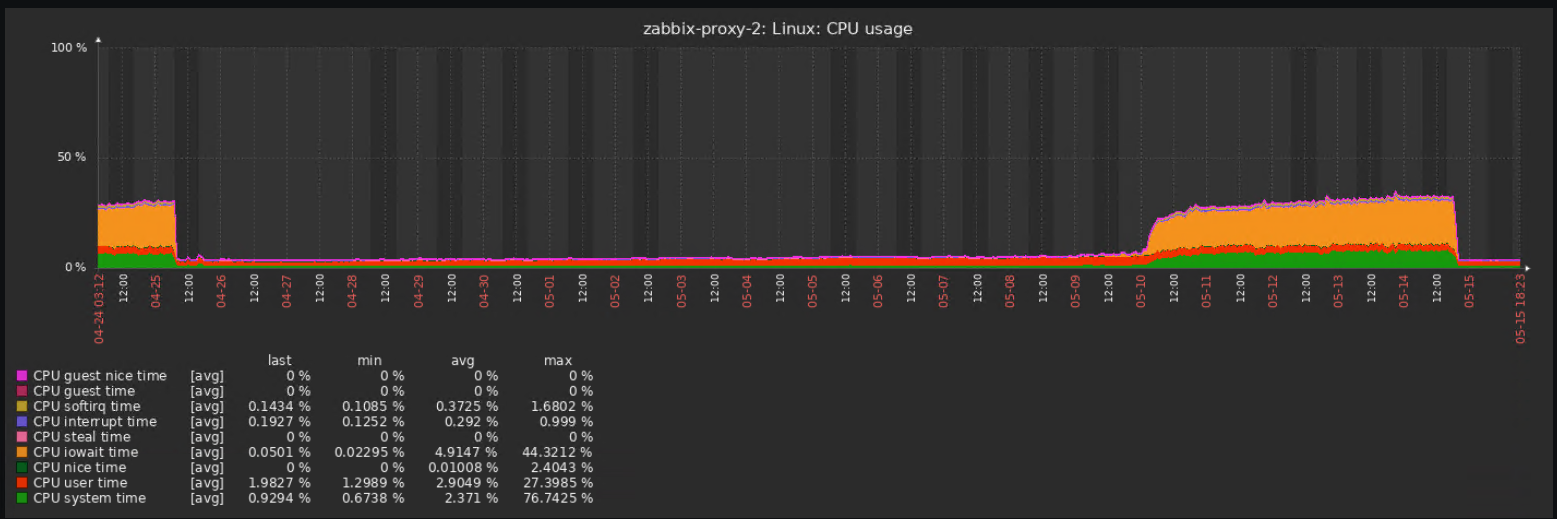
See screenshot...
See log file...
See memory dump...
root@zabbix-proxy-2 [~] # grep -vE '^#|^$' /etc/zabbix/zabbix_agent2.conf
PidFile=/run/zabbix/zabbix_agent2.pid
LogFile=/var/log/zabbix/zabbix_agent2.log
LogFileSize=0
Server=zabbix-prod-new,127.0.0.1
ListenPort=20050
ServerActive=zabbix-prod-new
Hostname=zabbix-proxy-2
EnablePersistentBuffer=1
PersistentBufferFile=/var/lib/zabbix/zabbix-agent2-persistent.db
Timeout=5
Include=/etc/zabbix/zabbix_agent2.d/*.conf
PluginSocket=/run/zabbix/agent.plugin.sock
ControlSocket=/run/zabbix/agent.sock
TLSConnect=psk
TLSAccept=psk
TLSPSKIdentity=PSK--zabbix-proxy
TLSPSKFile=/etc/zabbix/zabbix_agent2.psk
Include=./zabbix_agent2.d/plugins.d/*.conf
zabbix_agent2 -R metrics > zabbix_agent2--metrics--"$(date '+%Y_%m_%d-%H_%M_%S').txt"
cat /proc/`head -n 1 /run/zabbix/zabbix_agent2.pid`/smaps > zabbix_agent2--smaps--"$(date '+%Y_%m_%d-%H_%M_%S').txt"
cat /proc/`head -n 1 /run/zabbix/zabbix_agent2.pid`/maps > zabbix_agent2--maps--"$(date '+%Y_%m_%d-%H_%M_%S').txt"
root@zabbix-proxy-2 [~] # free -m
              total        used        free      shared  buff/cache   available
Mem:          15760       15388         173          36         198          89
Swap:         10239        6343        3896

root@zabbix-proxy-2 [~] # grep -i vmpeak /proc/`head -n 1 /run/zabbix/zabbix_agent2.pid`/status
VmPeak: 28971440 kB
root@zabbix-proxy-2 [~] # ./mem-check.sh | head -n 10
     24003.24 Mb /usr/sbin/zabbix_agent2
       176.08 Mb /usr/sbin/zabbix_proxy: agent poller #1 [got 101 values, queued 100 in 5 sec, awaiting 1]
       145.53 Mb /usr/sbin/zabbix_proxy: preprocessing manager #1 [queued 236, processed 4773 values, idle 4.930017 sec during 5.001238 sec]
       140.38 Mb /opt/HP/Discovery/bin/discagnt
        71.15 Mb /usr/sbin/zabbix_proxy: configuration syncer [synced config 36 bytes in 0.097800 sec, idle 10 sec]
        66.38 Mb /usr/lib/polkit
        45.17 Mb /usr/sbin/zabbix_proxy: discovery manager #1 [processing 0 rules, 0 unsaved checks]
        39.08 Mb /usr/sbin/zabbix_proxy: http agent poller #1 [got 0 values, queued 0 in 5 sec, awaiting 0]
        39.08 Mb /usr/sbin/zabbix_proxy: snmp poller #1 [got 0 values, queued 0 in 5 sec, awaiting 0]
        38.25 Mb /usr/libexec/platform


The zabbix-proxy service is still running on this server, but it does not currently monitor anything other than this one agent.
Expected:
See screenshot....
See attached patch file...

