-
Type:
Problem report
-
Resolution: Incomplete
-
Priority:
 Trivial
-
None
-
Affects Version/s: None
-
Component/s: None
-
None
Zabbix Version: 7.2
Setup: Zabbix Server and Proxy monitoring Kubernetes cluster using Helm chart
Template Used: Kubernetes cluster state by HTTP
Result:
i have setup a zabbix server and monitoing my k8 cluster using helm chart (using template = Kubernetes cluster state by HTTP) , i can see the resources but they are not updating
unless i restart the proxy pod. after deleting the pod when it comes to running the latest data is updated once and then again it stops updating.
Added following env variables to the proxy pods
name: ZBX_CACHESIZE
value: 64G name: ZBX_STARTHTTPPOLLERS
value: "100" name: ZBX_STARTPOLLERS
value: "300" name: ZBX_STARTPOLLERSUNREACHABLE
value: "20" name: ZBX_STARTAGENTPOLLERS
value: "75" name: ZBX_STARTHTTPAGENTPOLLERS
value: "75" name: ZBX_STARTTRAPPERS
value: "100" name: ZBX_STARTDBSYNCERS
value: "100" name: ZBX_STARTPREPROCESSORS
value: "300" name: ZBX_HISTORYCACHESIZE
value: 2G name: ZBX_HISTORYINDEXCACHESIZE
value: 2G name: ZBX_HOUSEKEEPINGFREQUENCY
value: "1" name: ZBX_STARTDISCOVERERS
value: "25" name: ZBX_LOGSLOWQUERIES
value: "3000" name: ZBX_TIMEOUT
value: "20" name: DB_SERVER_HOST
value: <SERVER_IP> name: MYSQL_USER
value: zabbix name: MYSQL_PASSWORD
value: zabbix name: MYSQL_DATABASE
value: zabbix_proxy_2
and image
image: zabbix/zabbix-proxy-mysql:alpine-7.2.4
zabbix proxy pods is running on a worker node with cofig
Capacity:
cpu: 256,
memory: ~1.47 TiB (1584933884Ki),
ephemeral-storage: ~13.86 TiB (14881864456Ki)
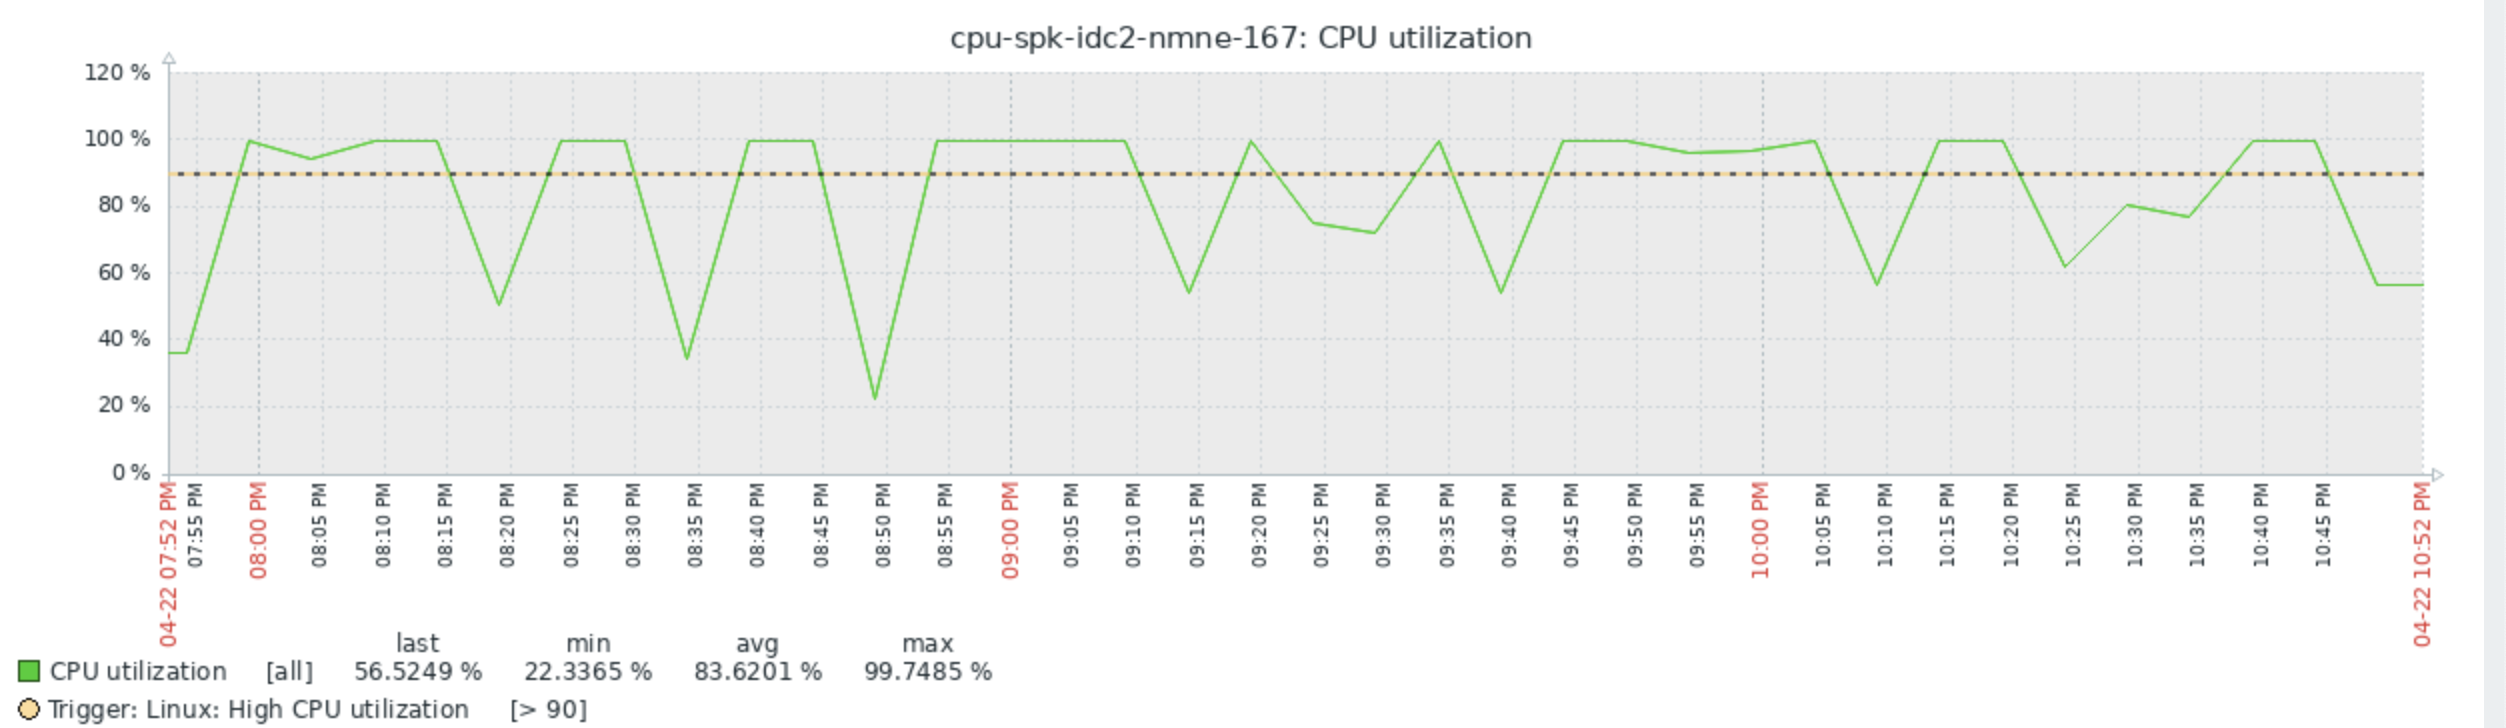
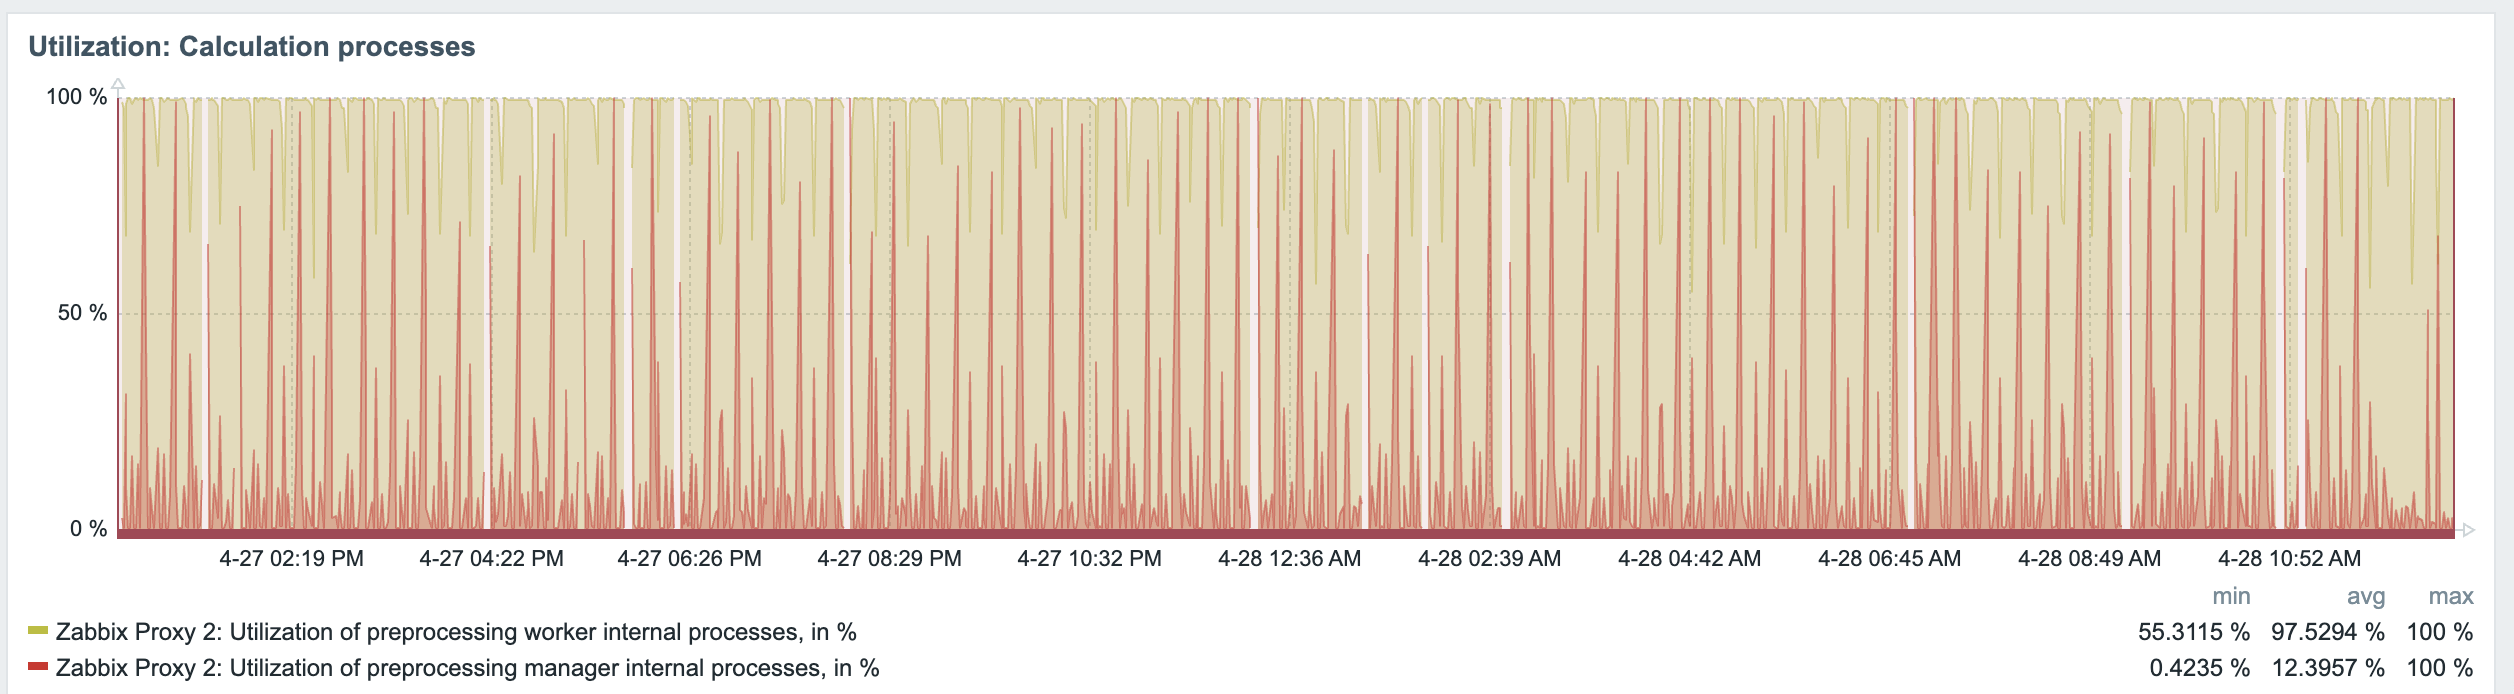
and still the cpu ussage is 99% when the data from get state metric master item is collected, and during preprocessing.
the data collected from the get state metric master item is around 70 MB
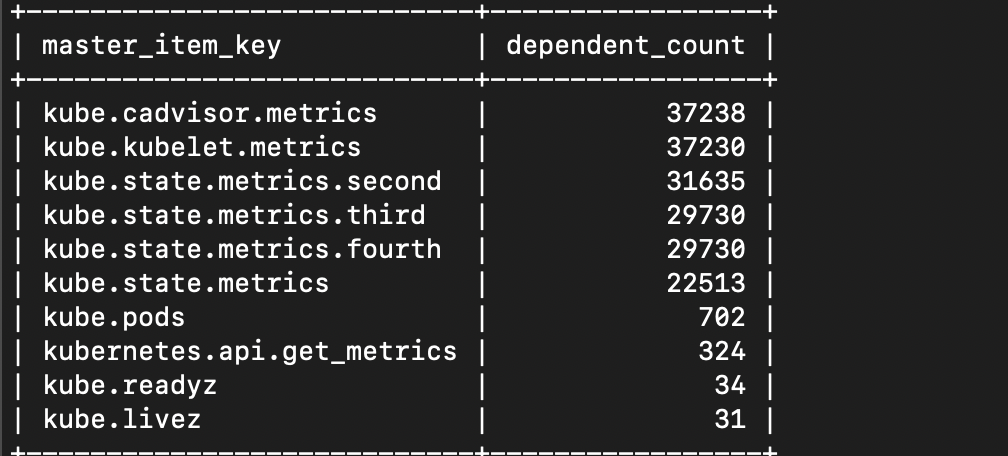
and there are a lot of dependent items on it
so as suggested by issue
https://support.zabbix.com/browse/ZBX-20590
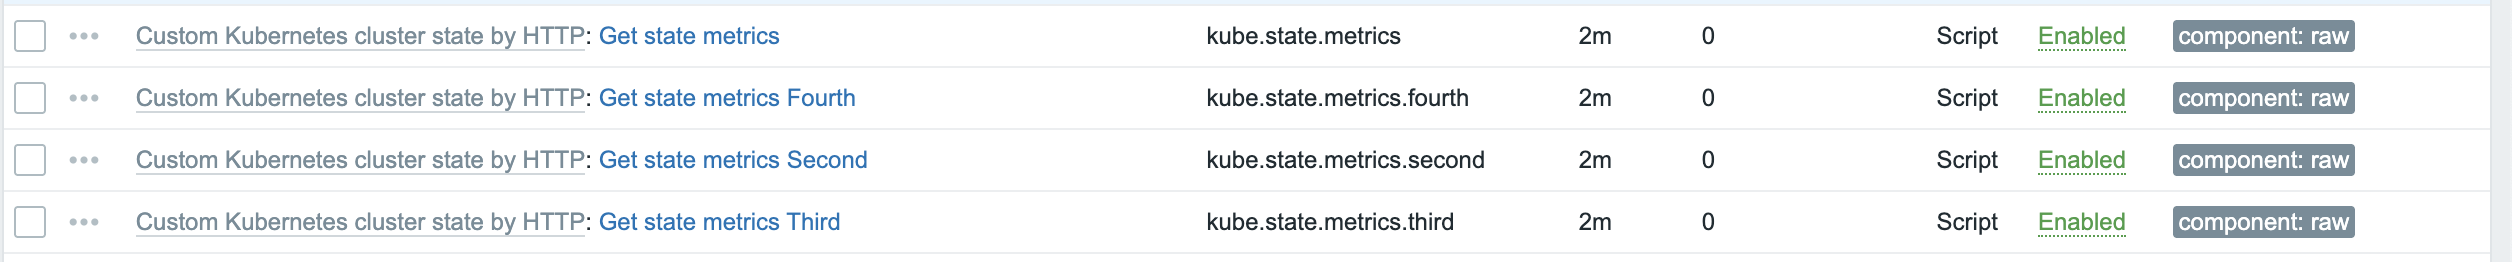
i modified the template and made multiple master items of get state metric and divided the dependent items, but still the last check and the data is not being updated of the resouces and if i create a new resource (like deployment) its is not showing unless i restart the proxy pod.
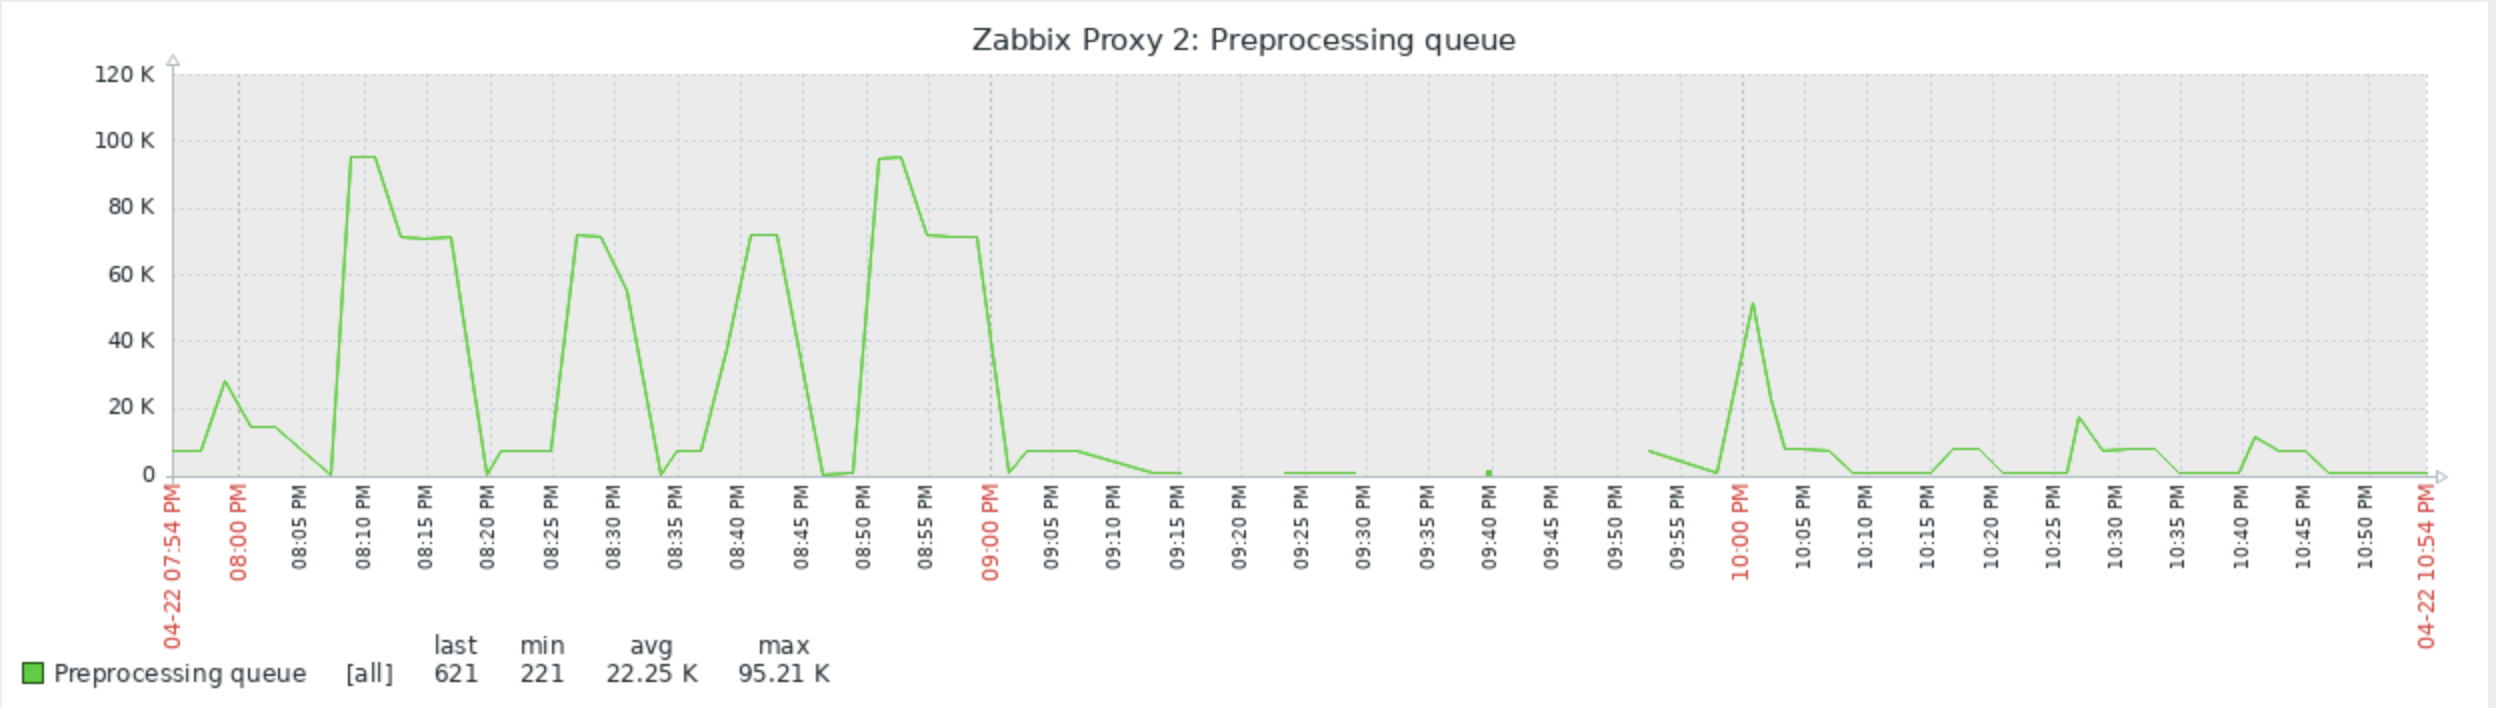
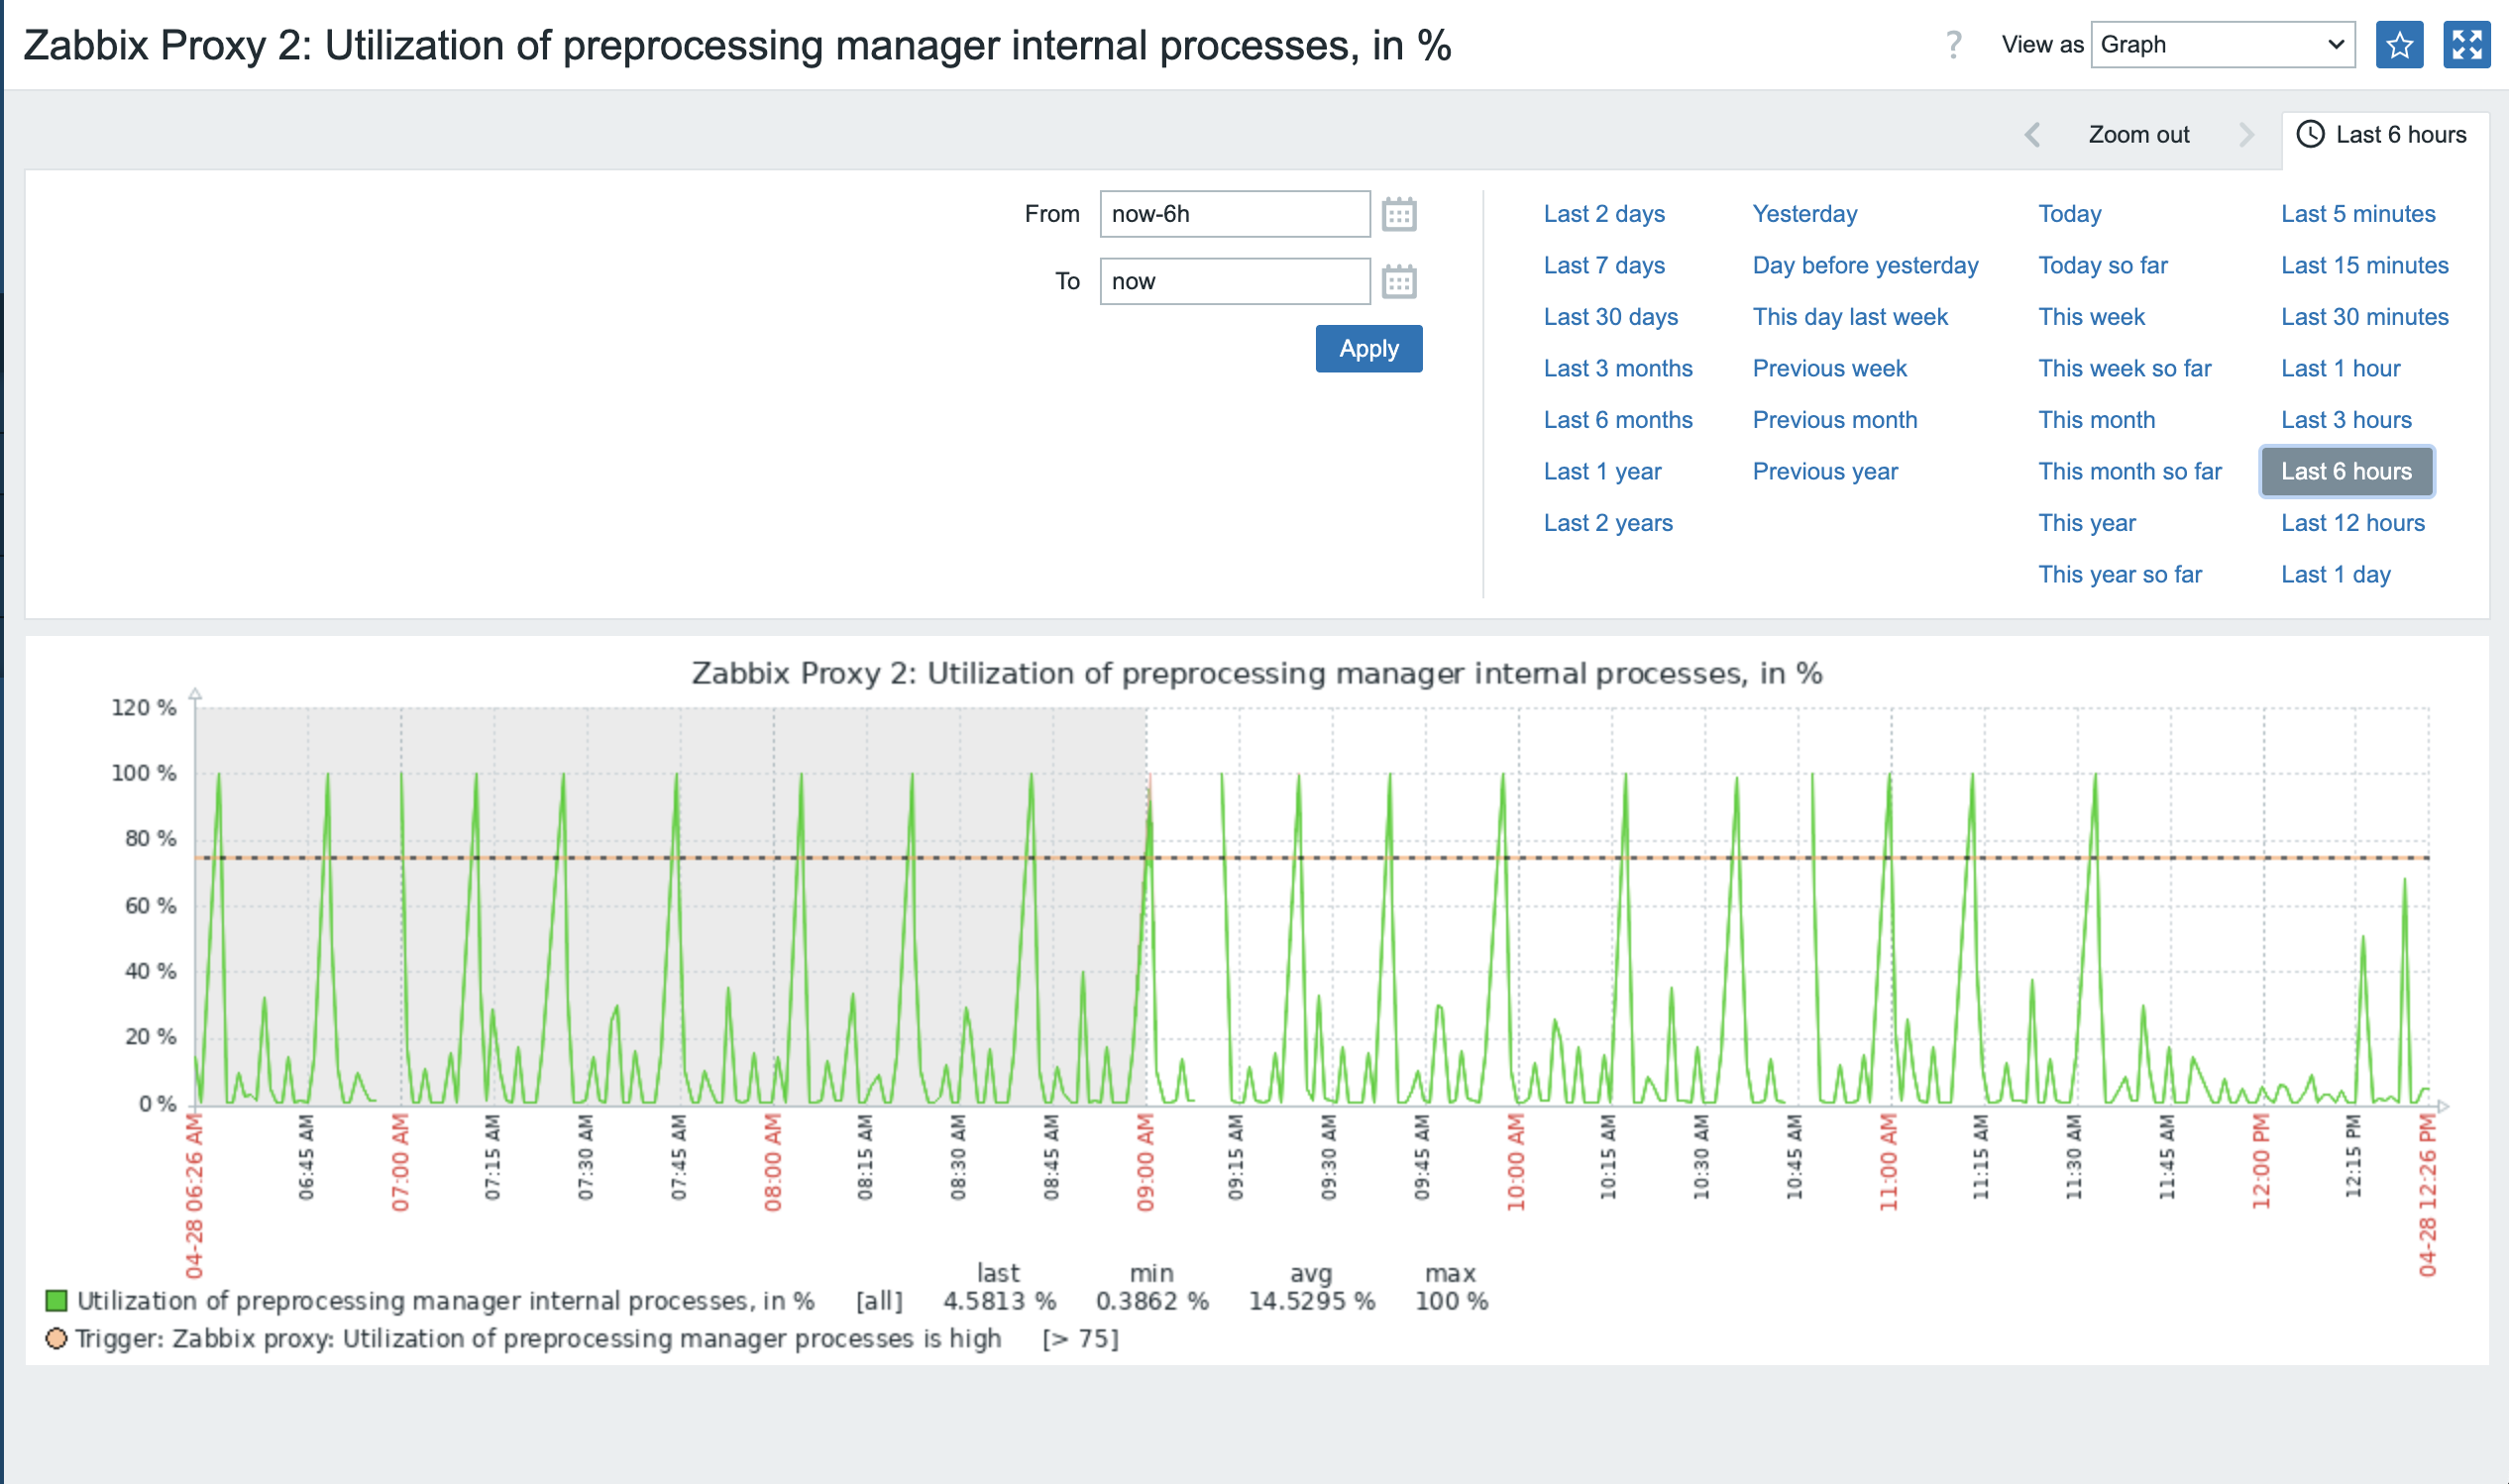
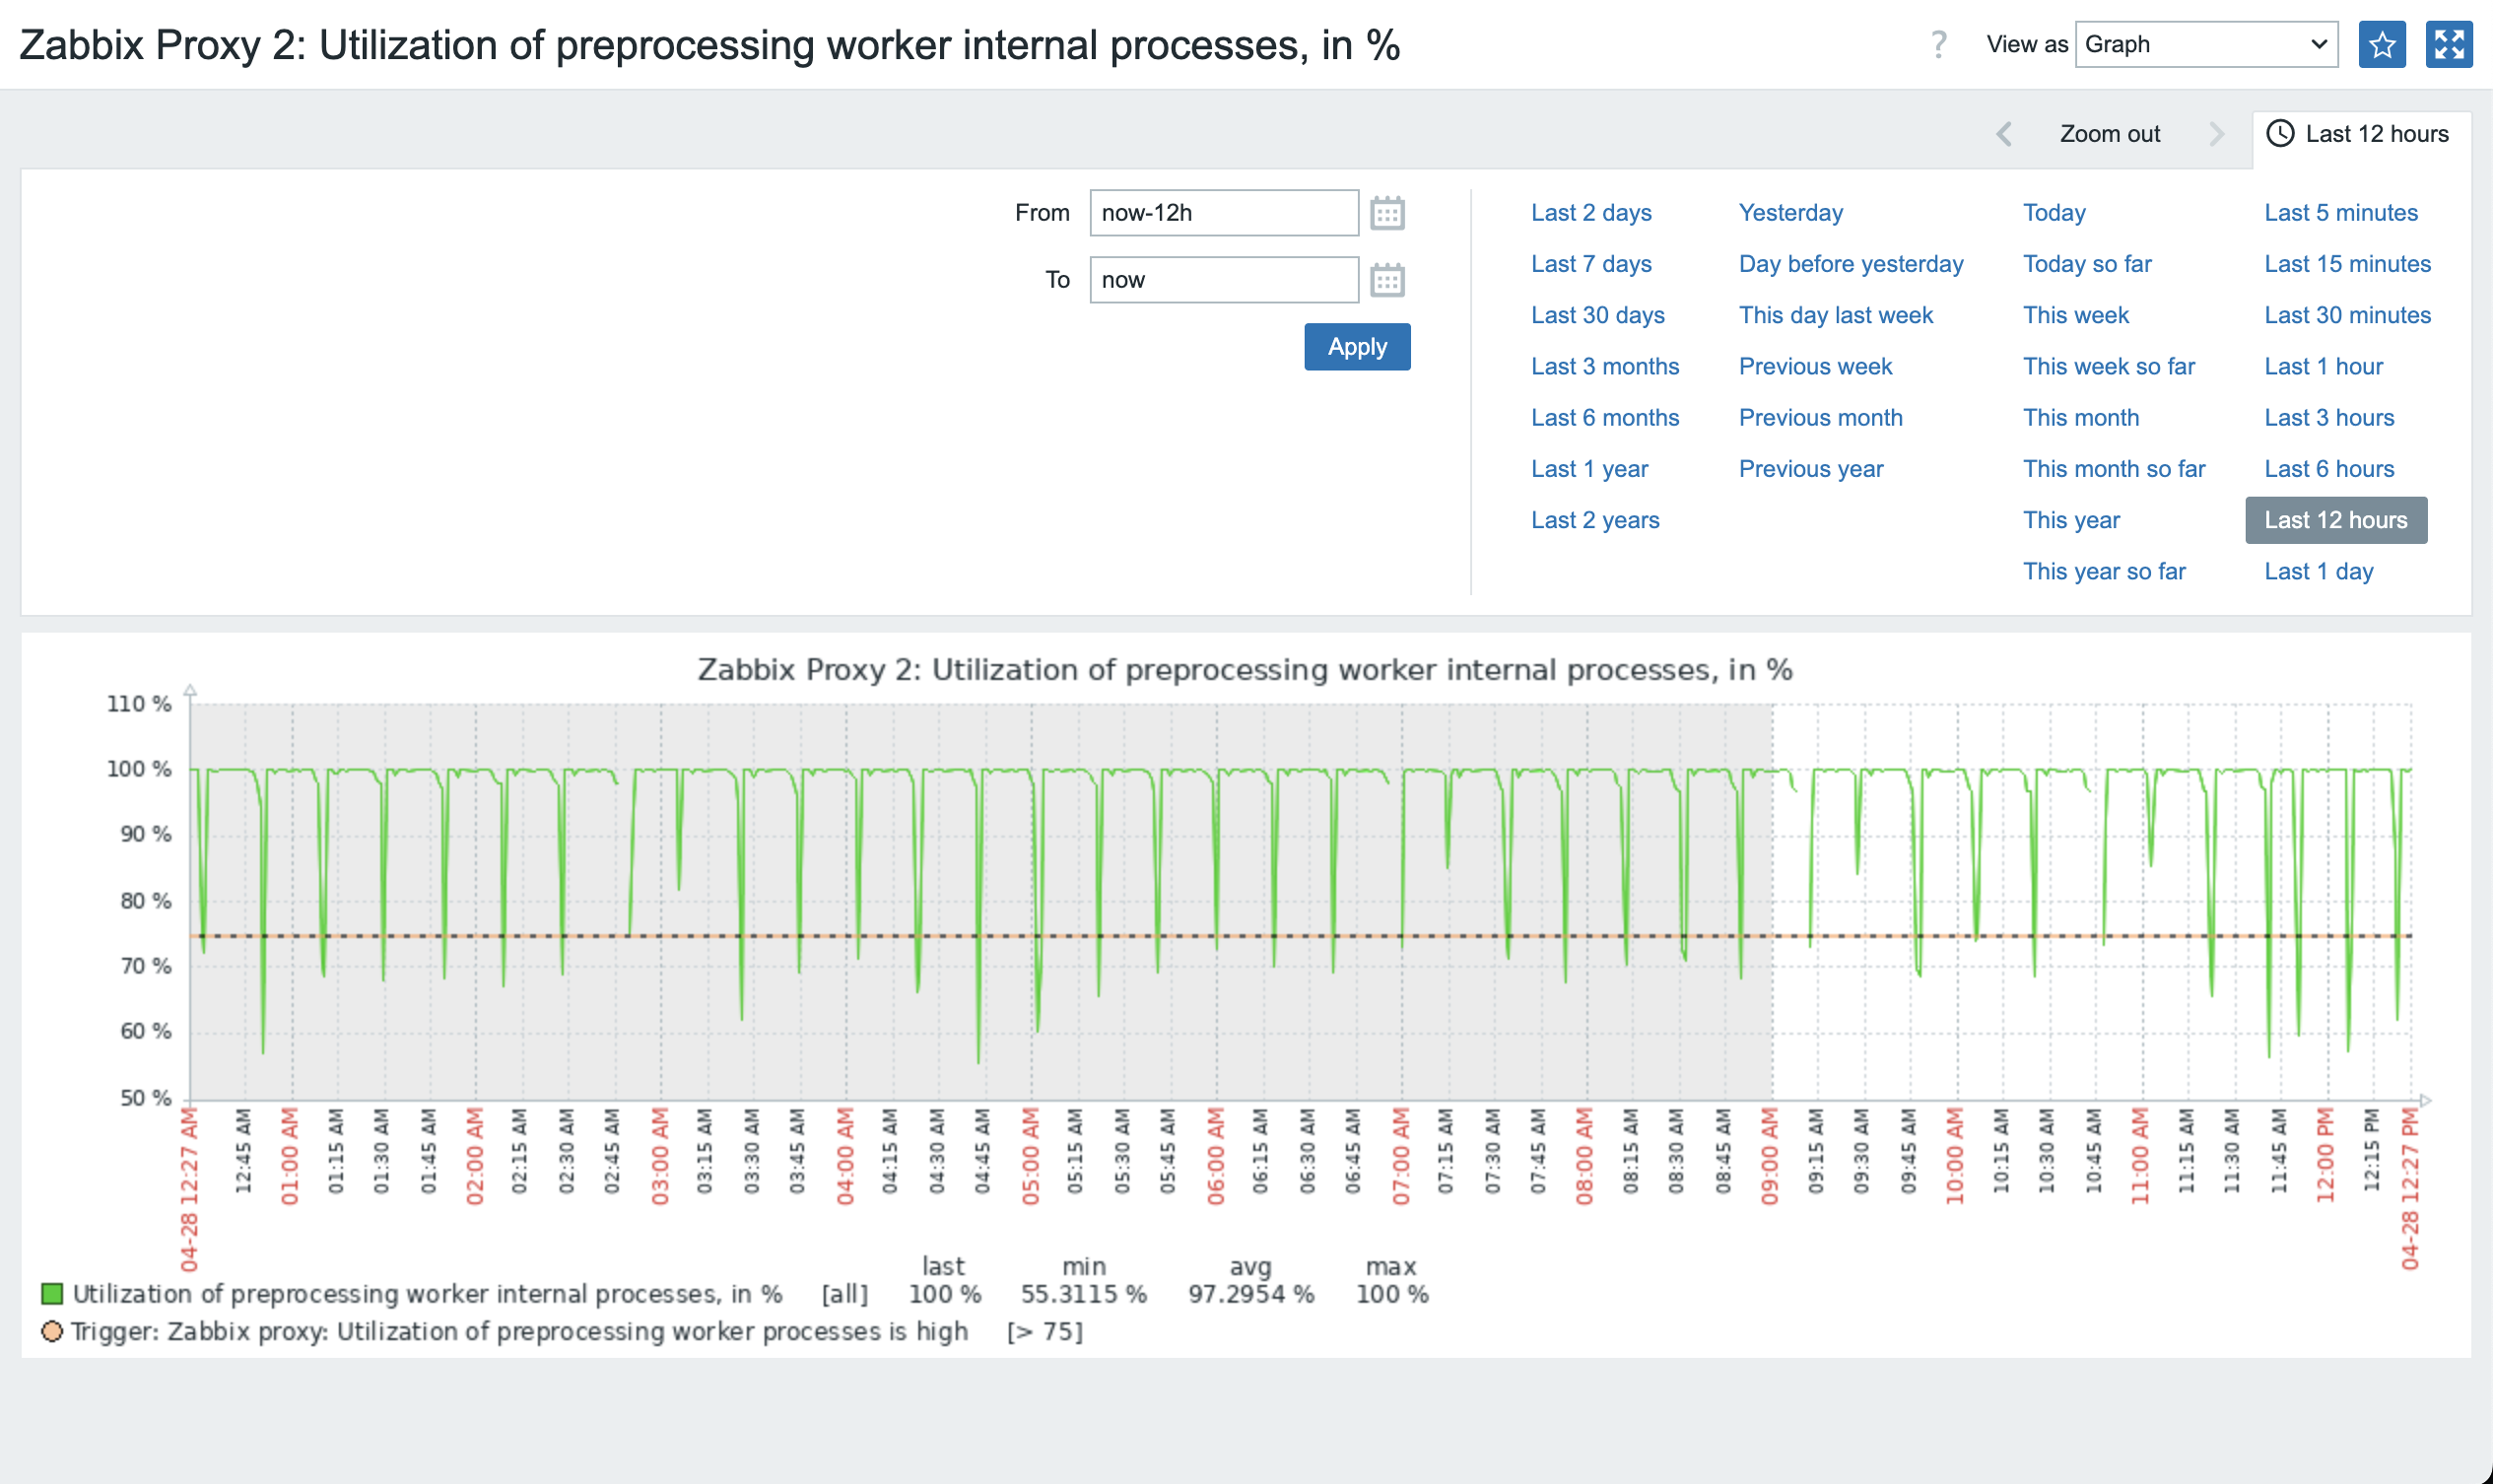
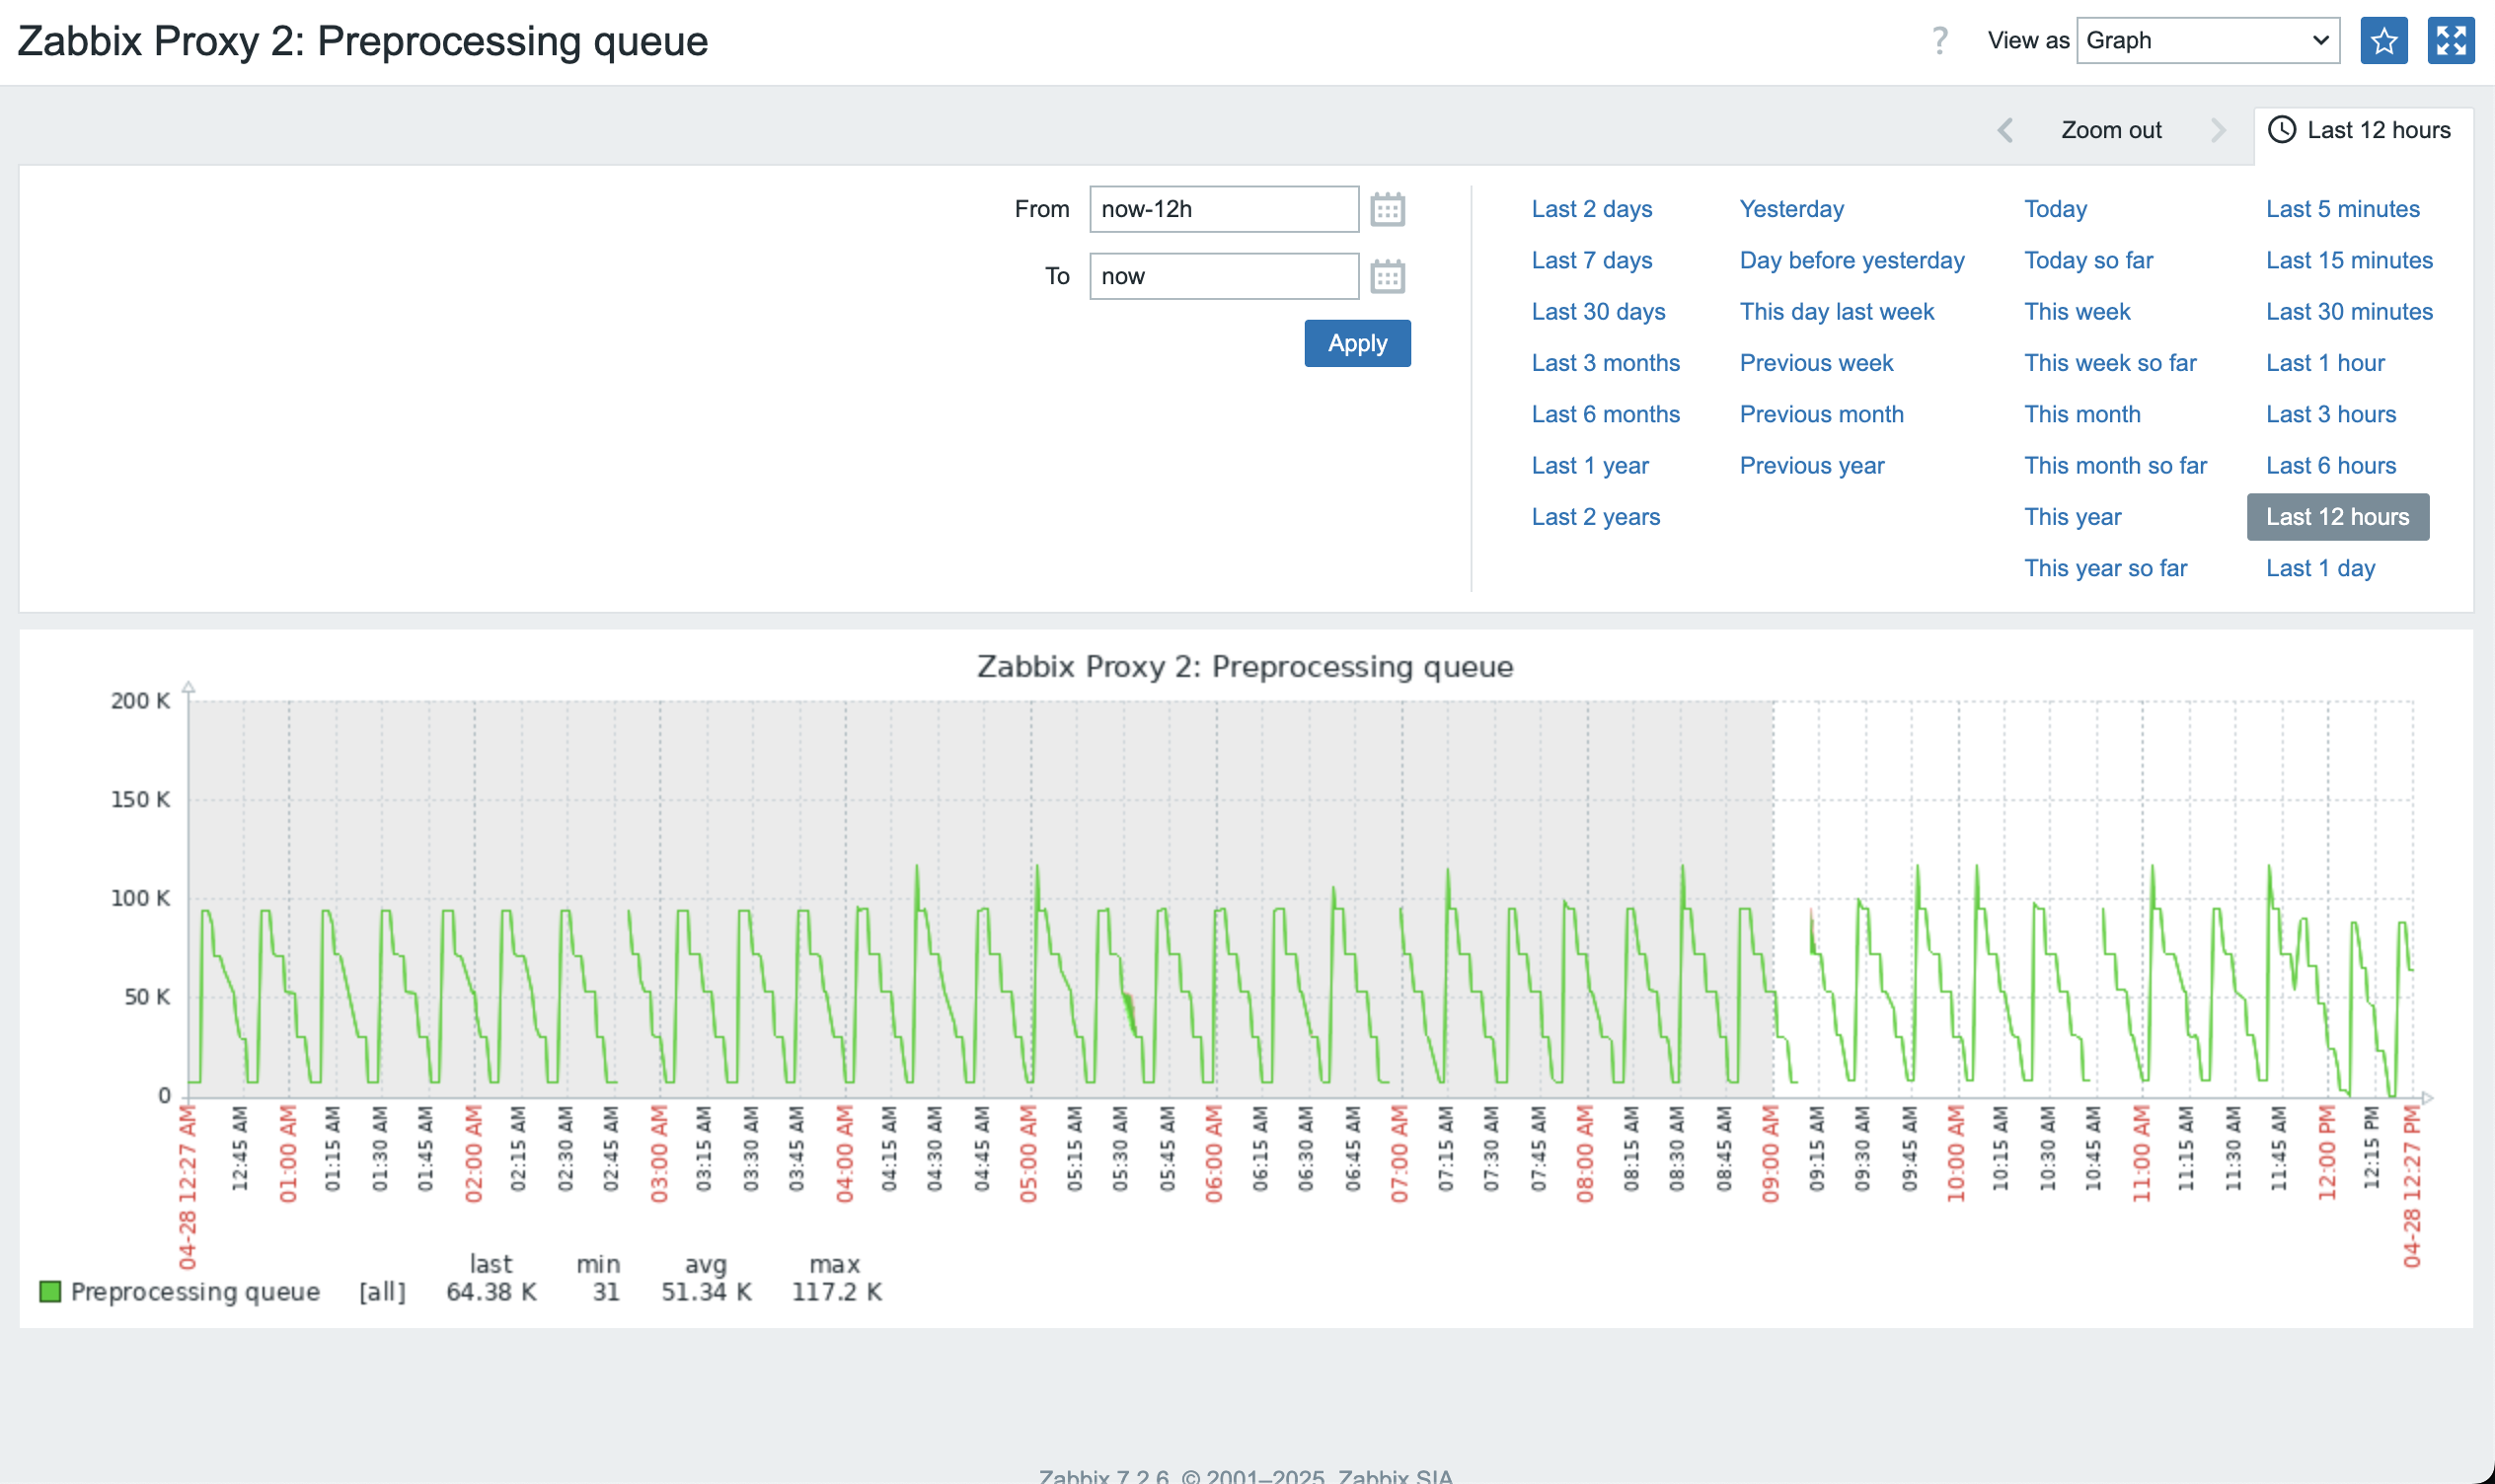
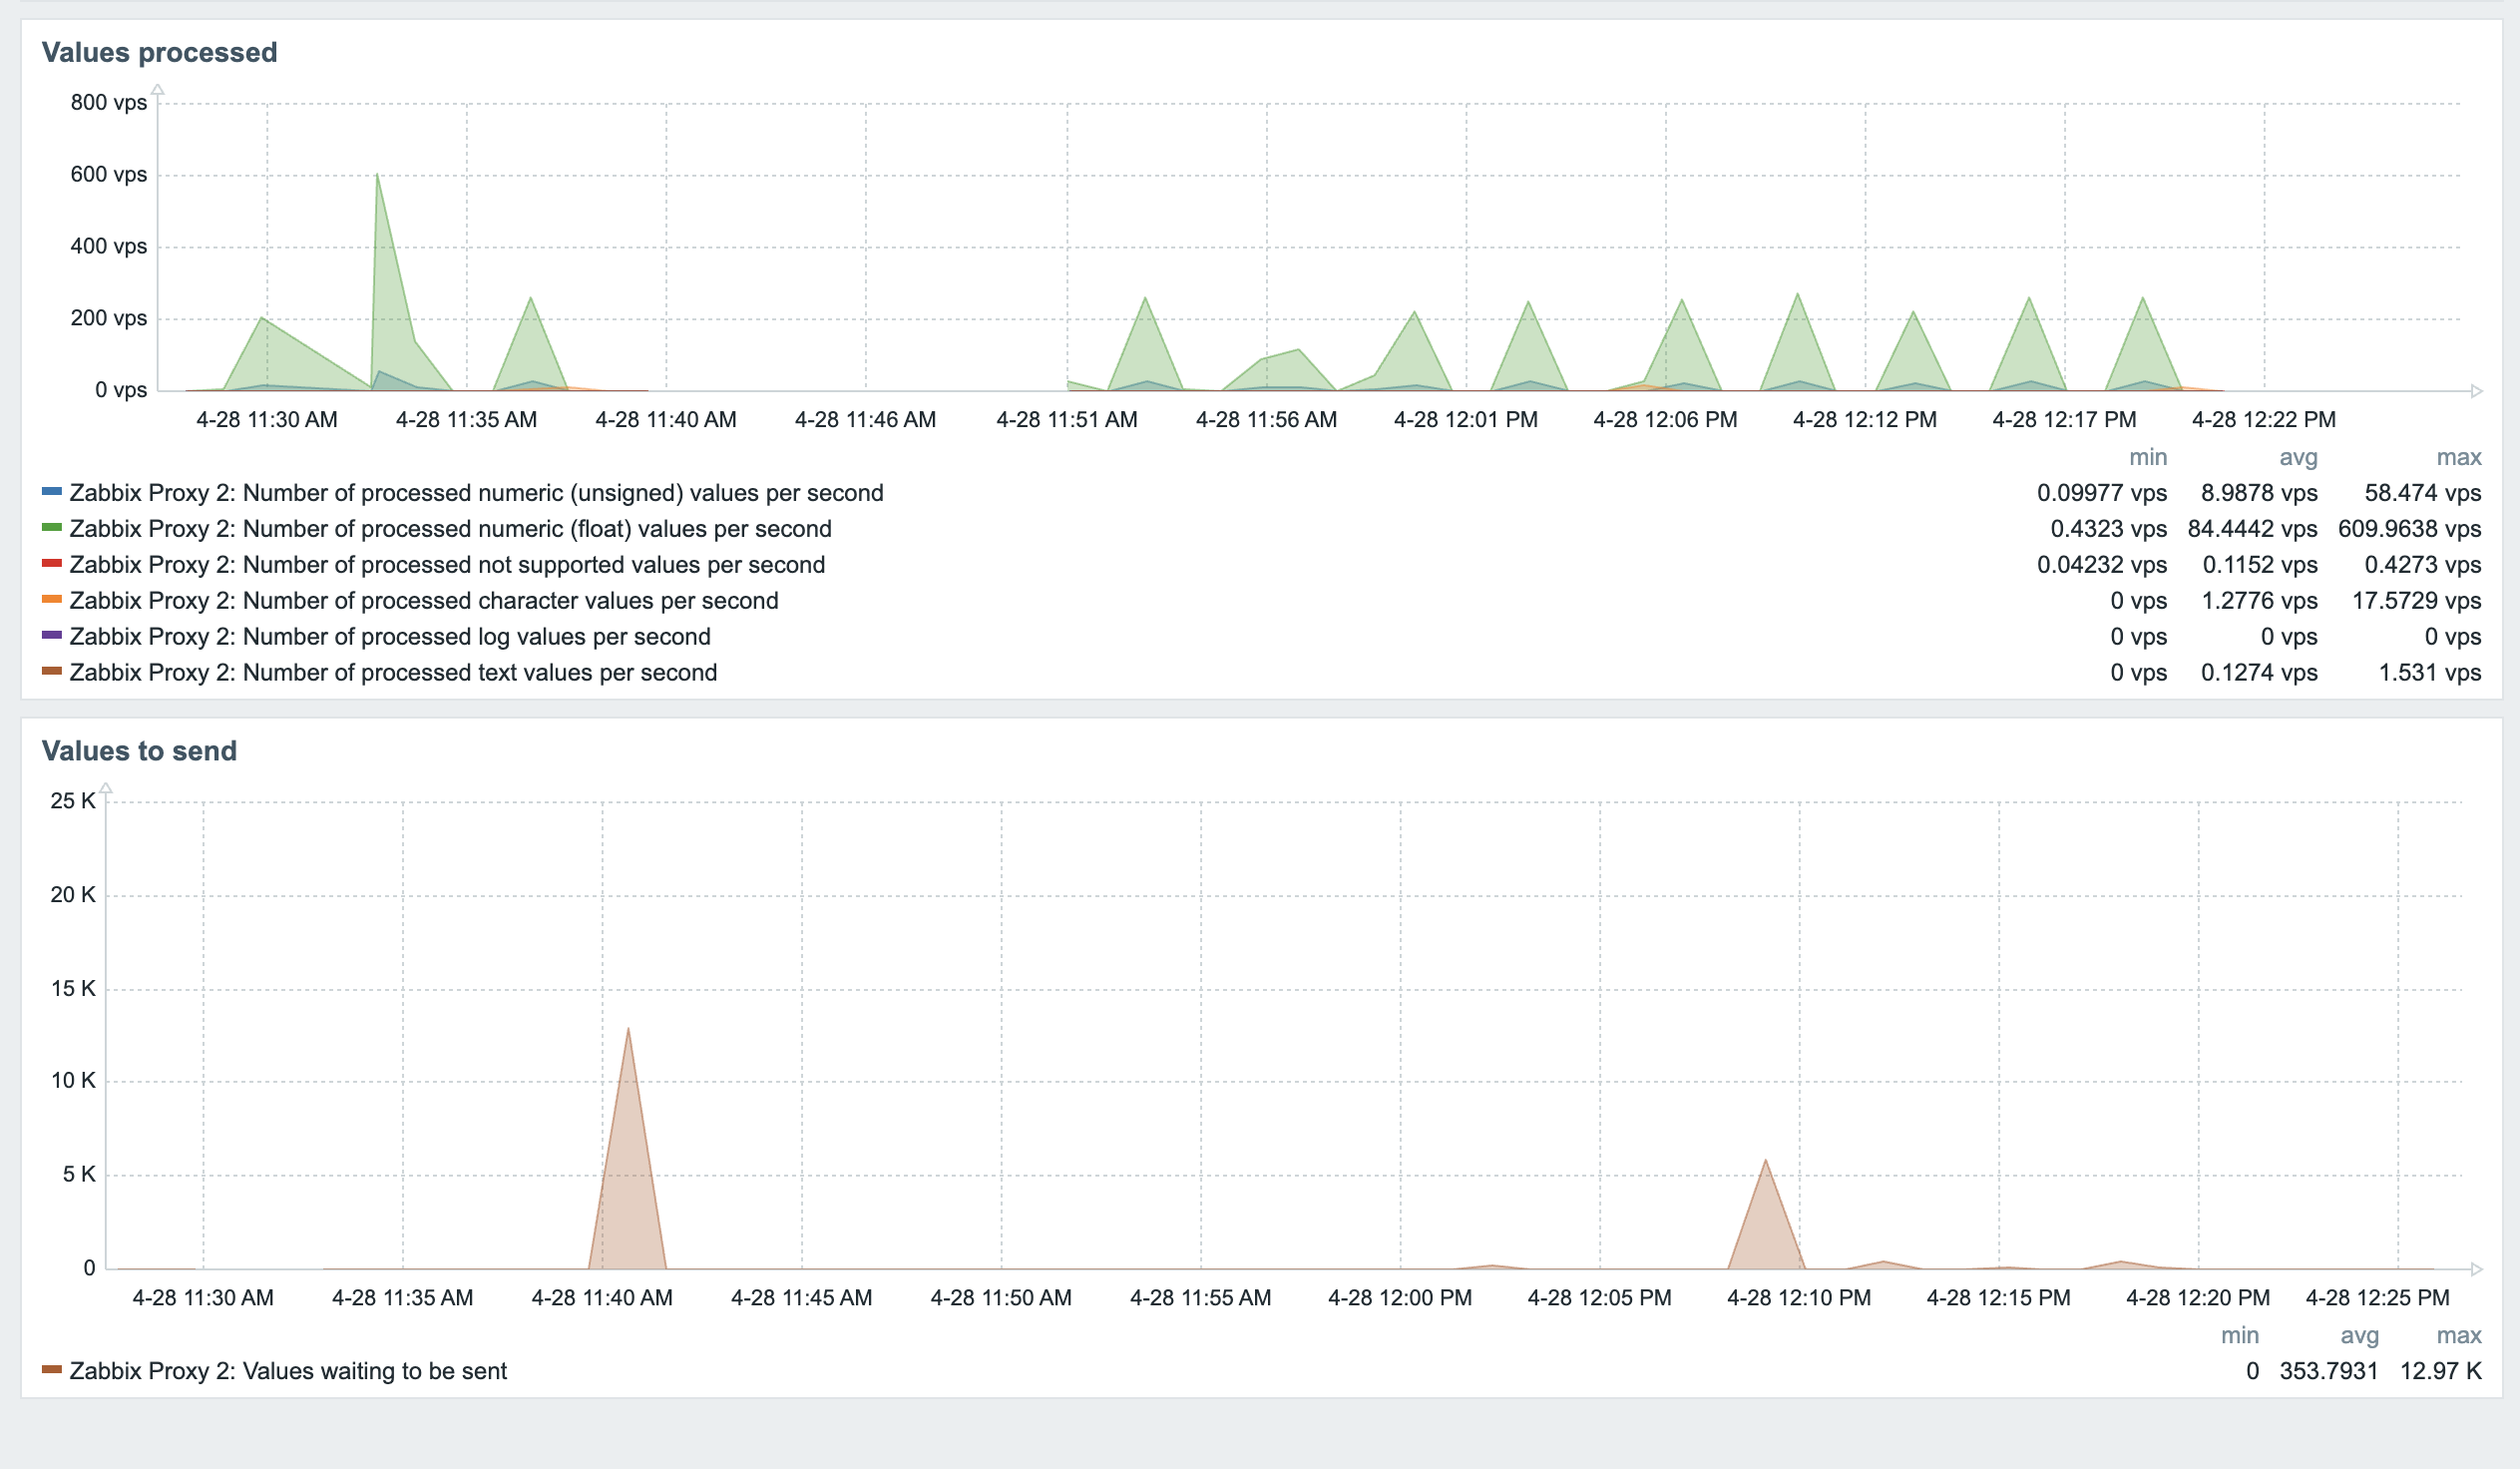
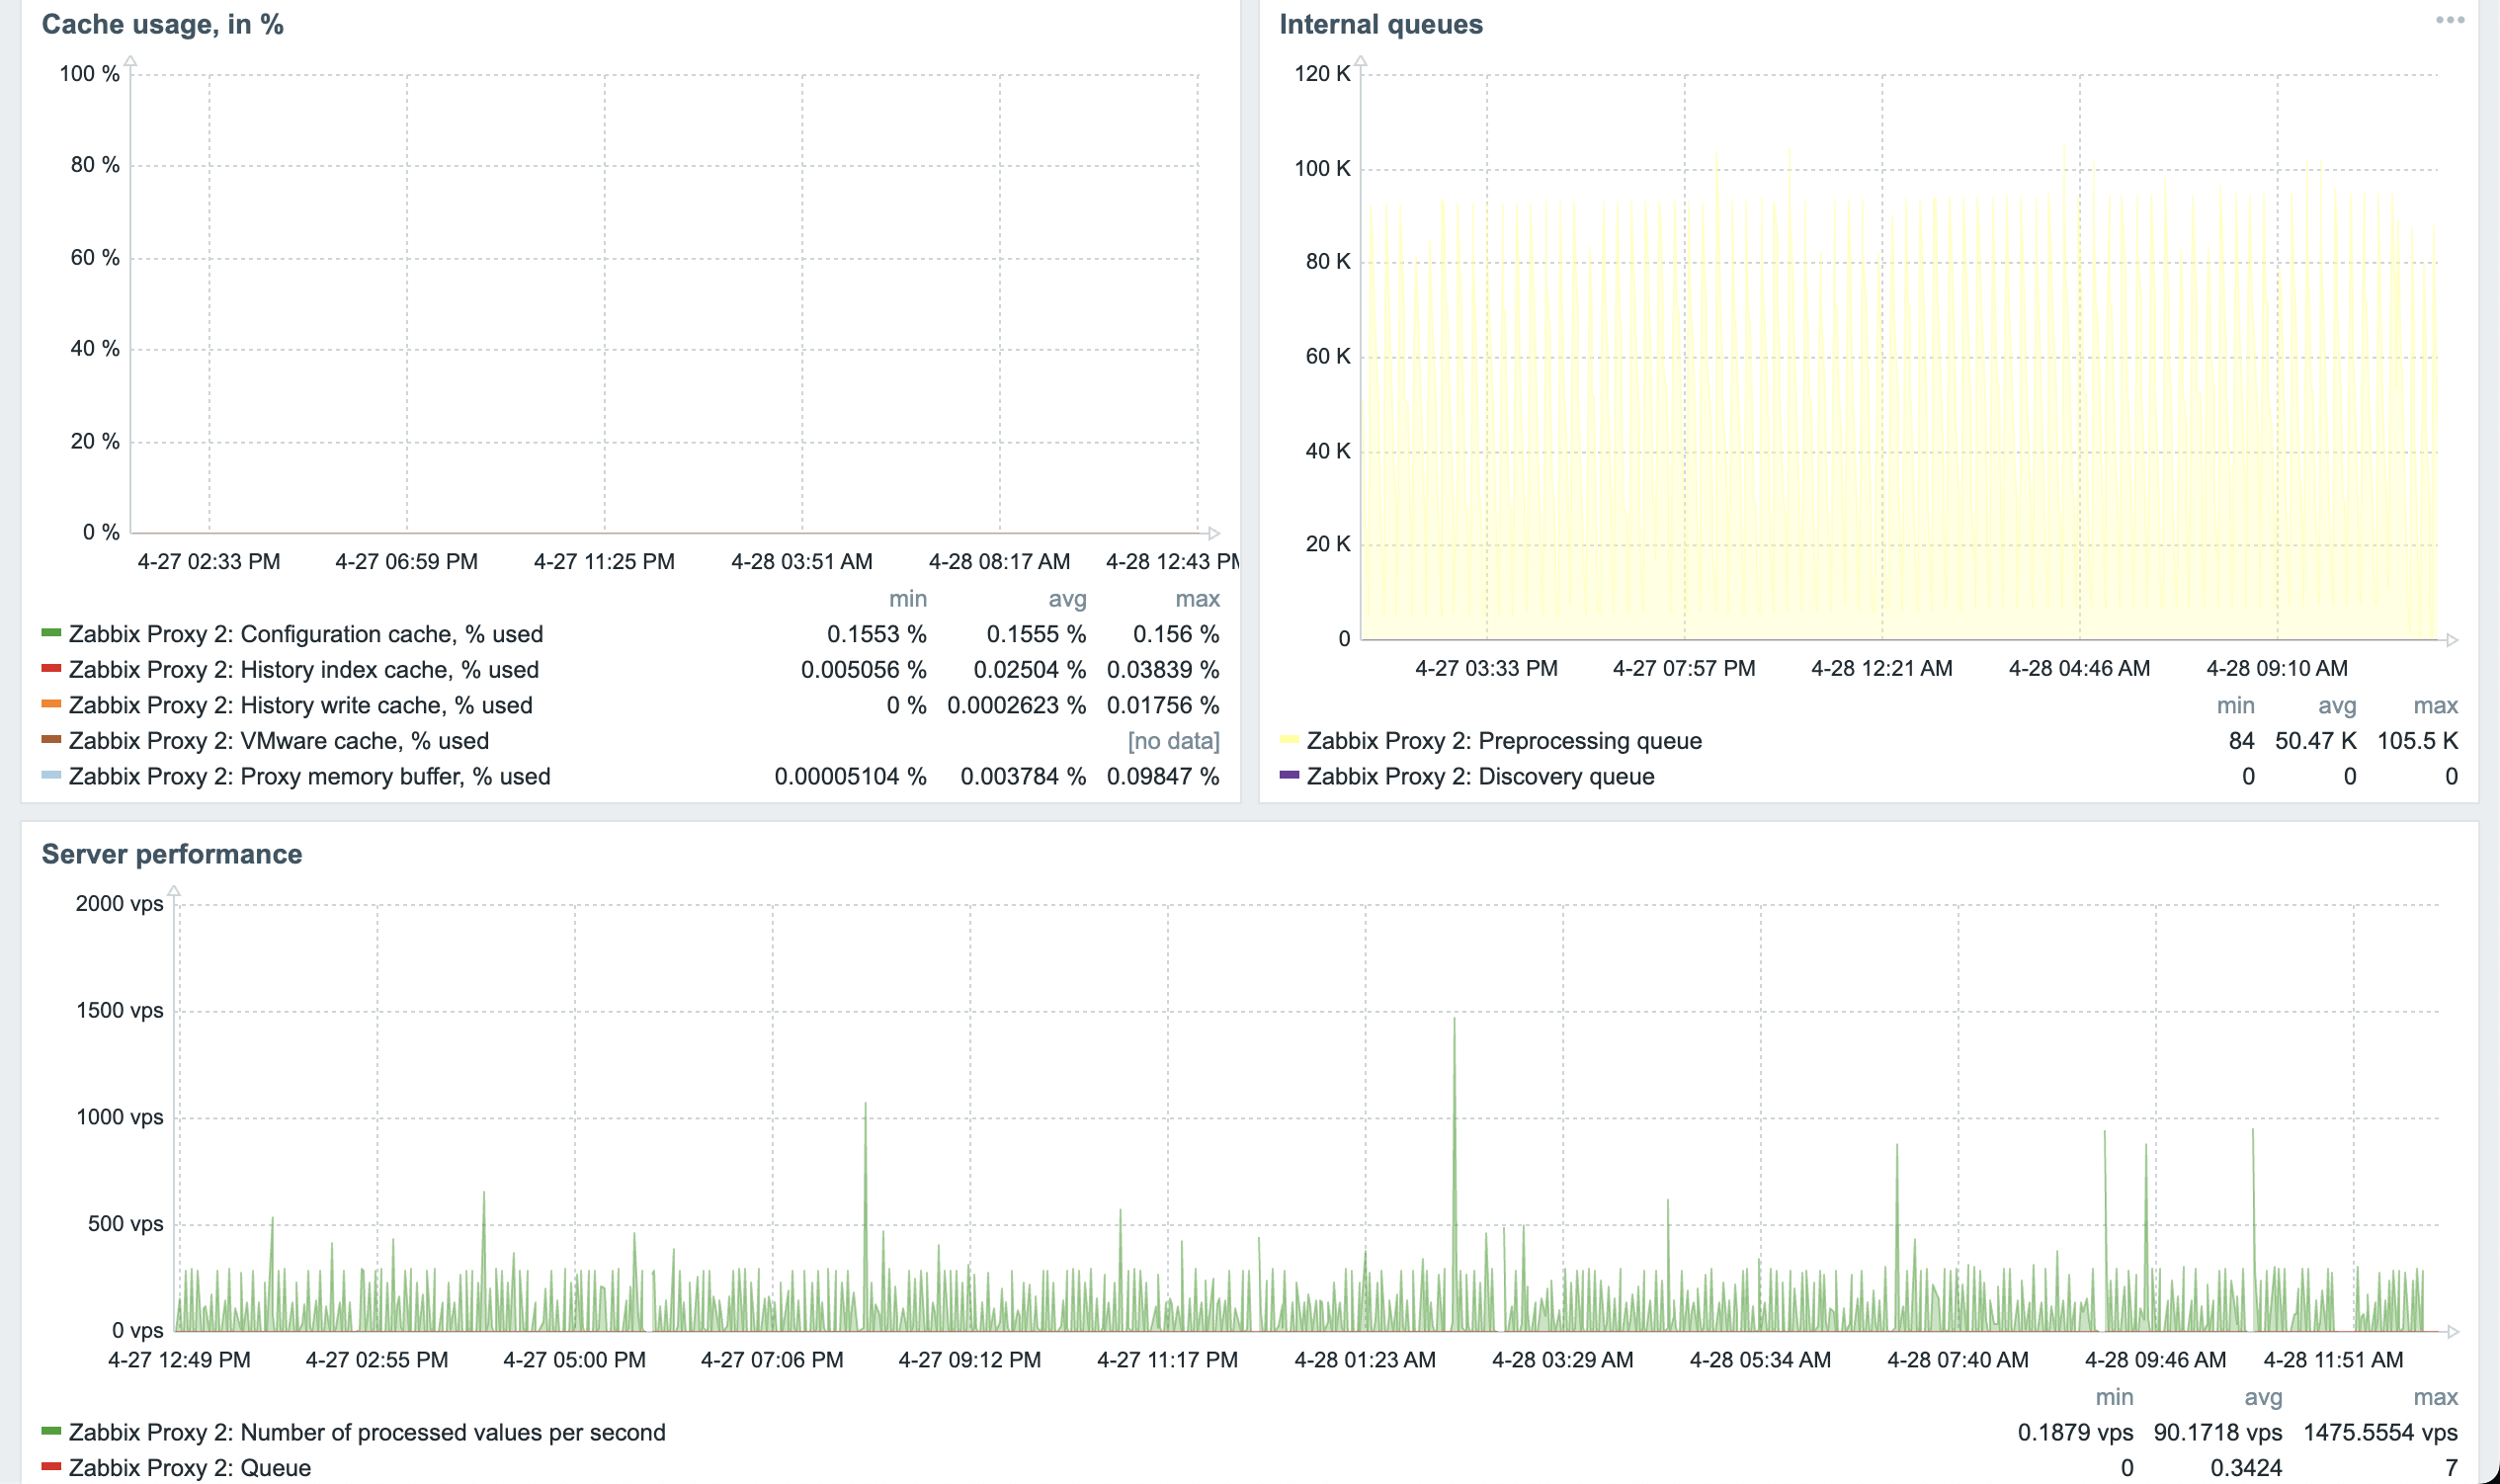
I have also increased the update interval of all get state metric master items to 2m so that the queue get cleared which it does.
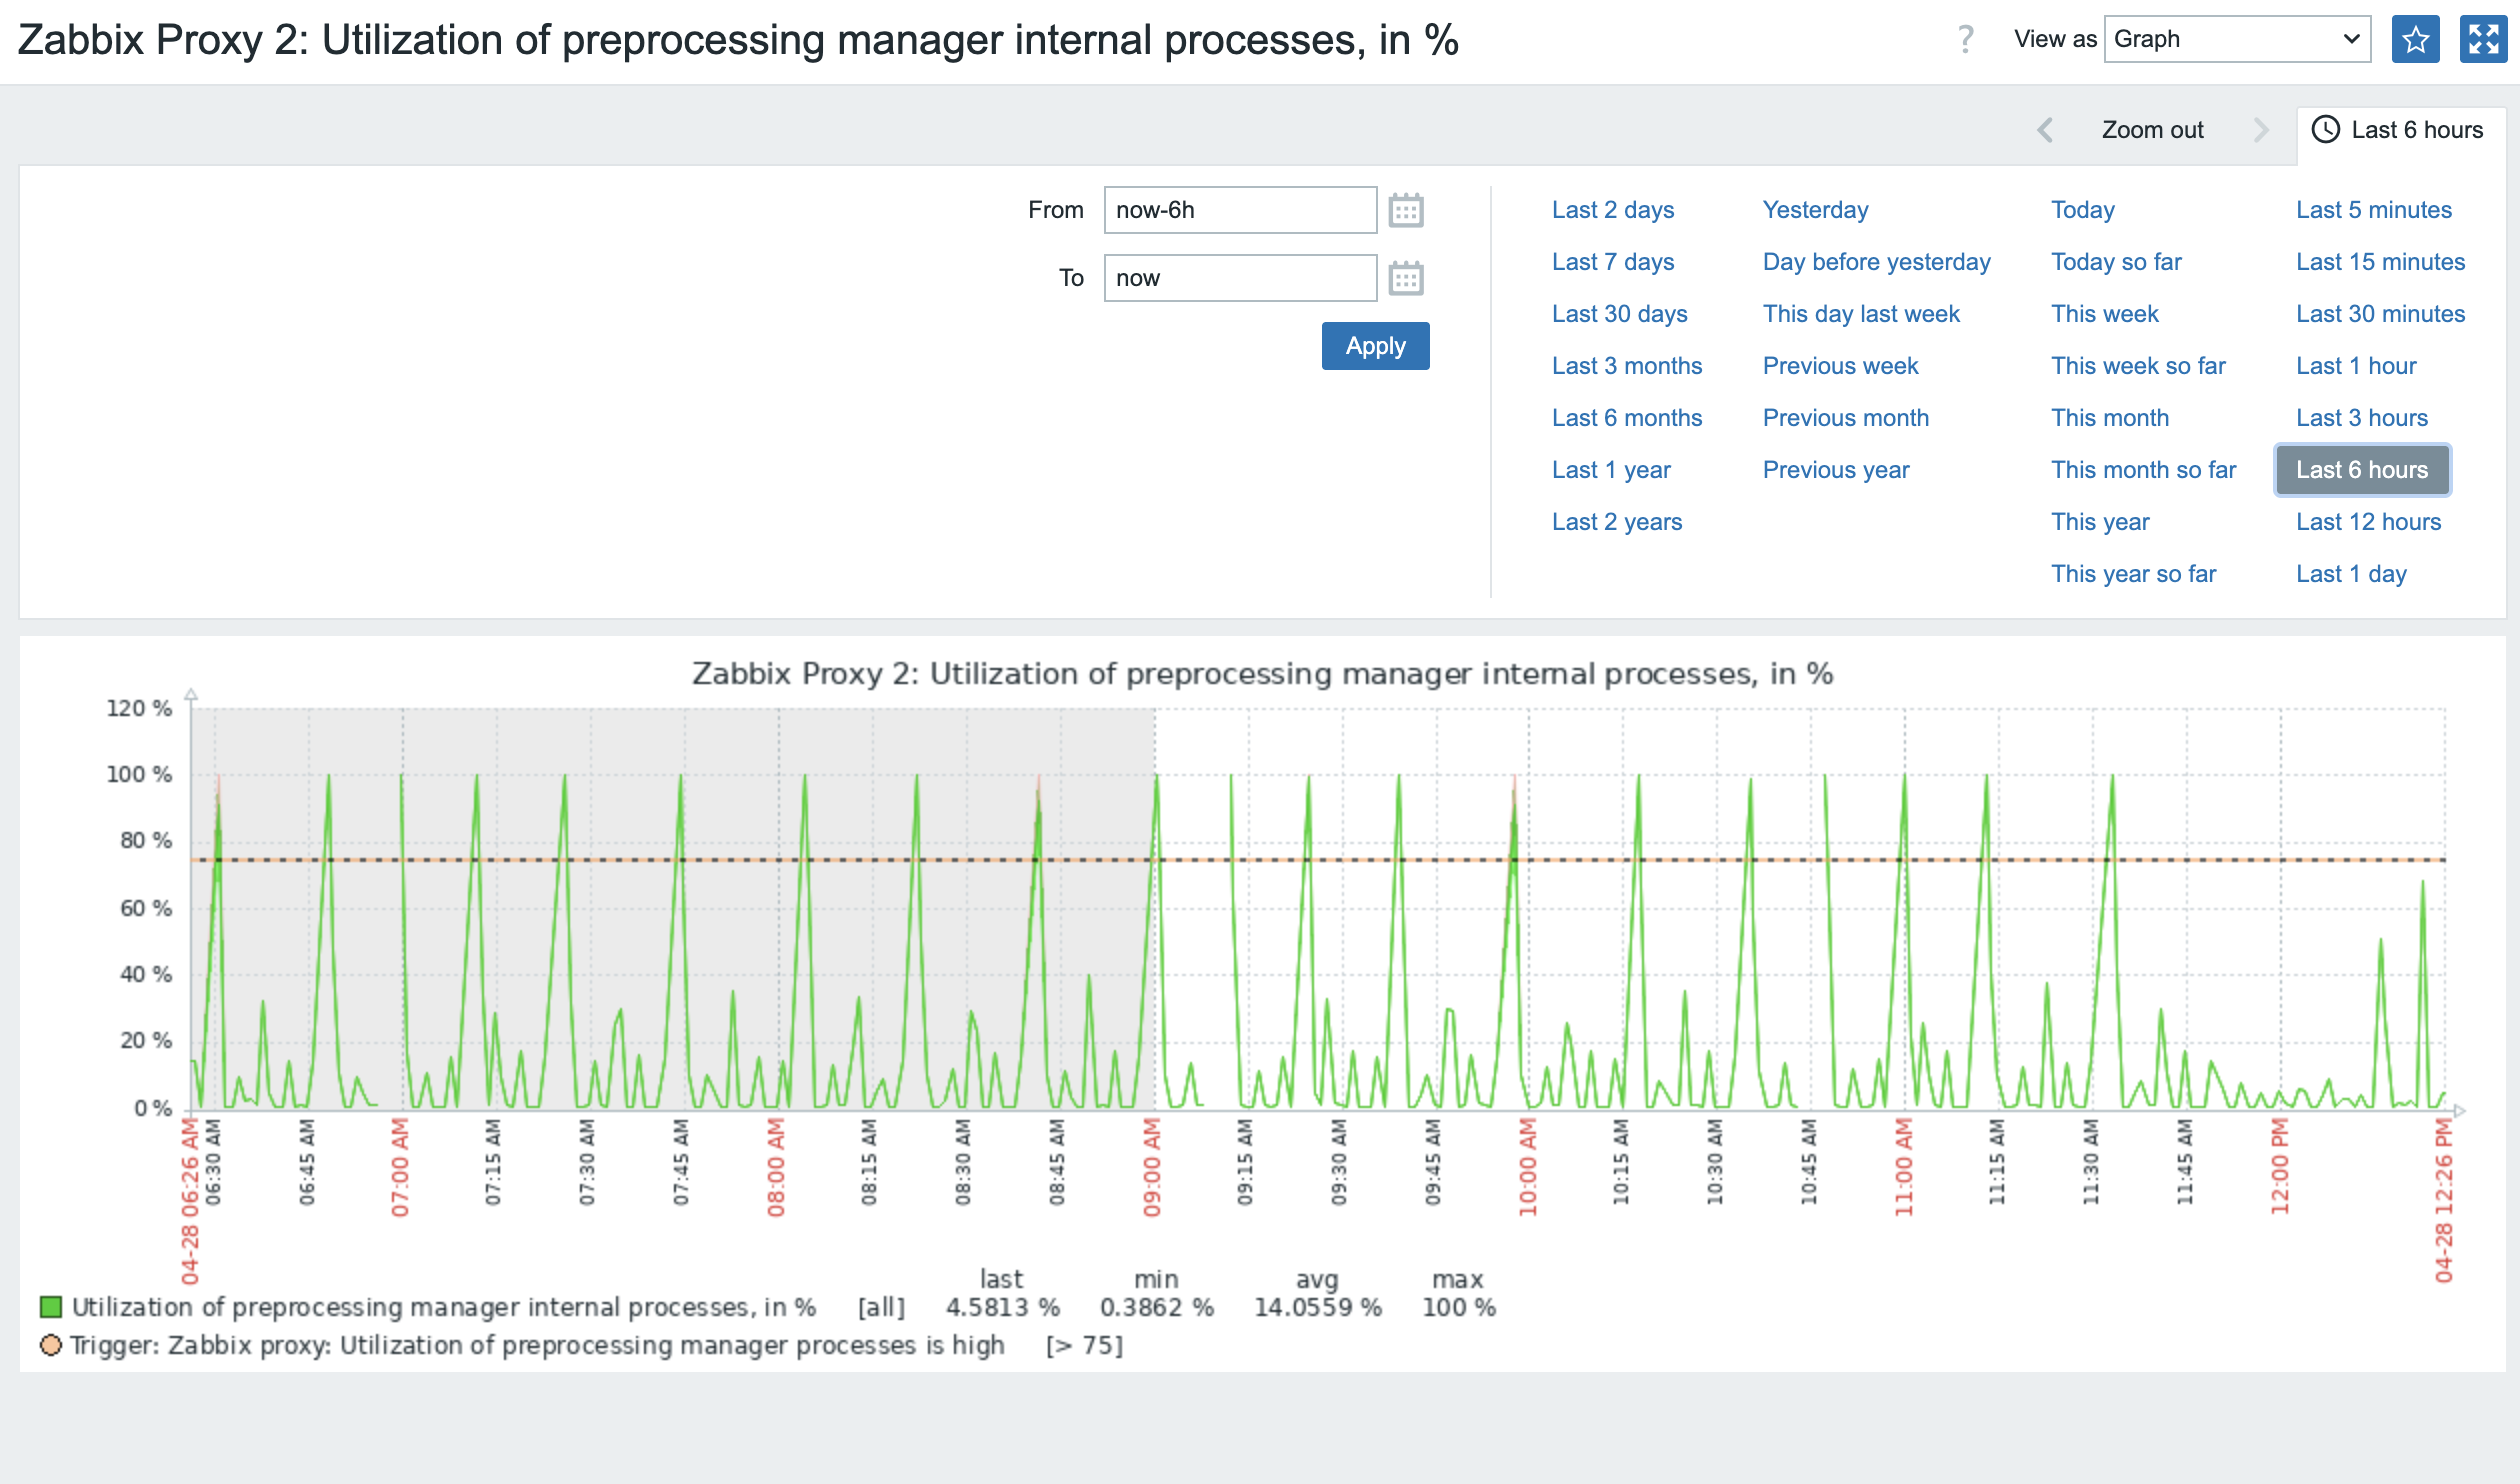
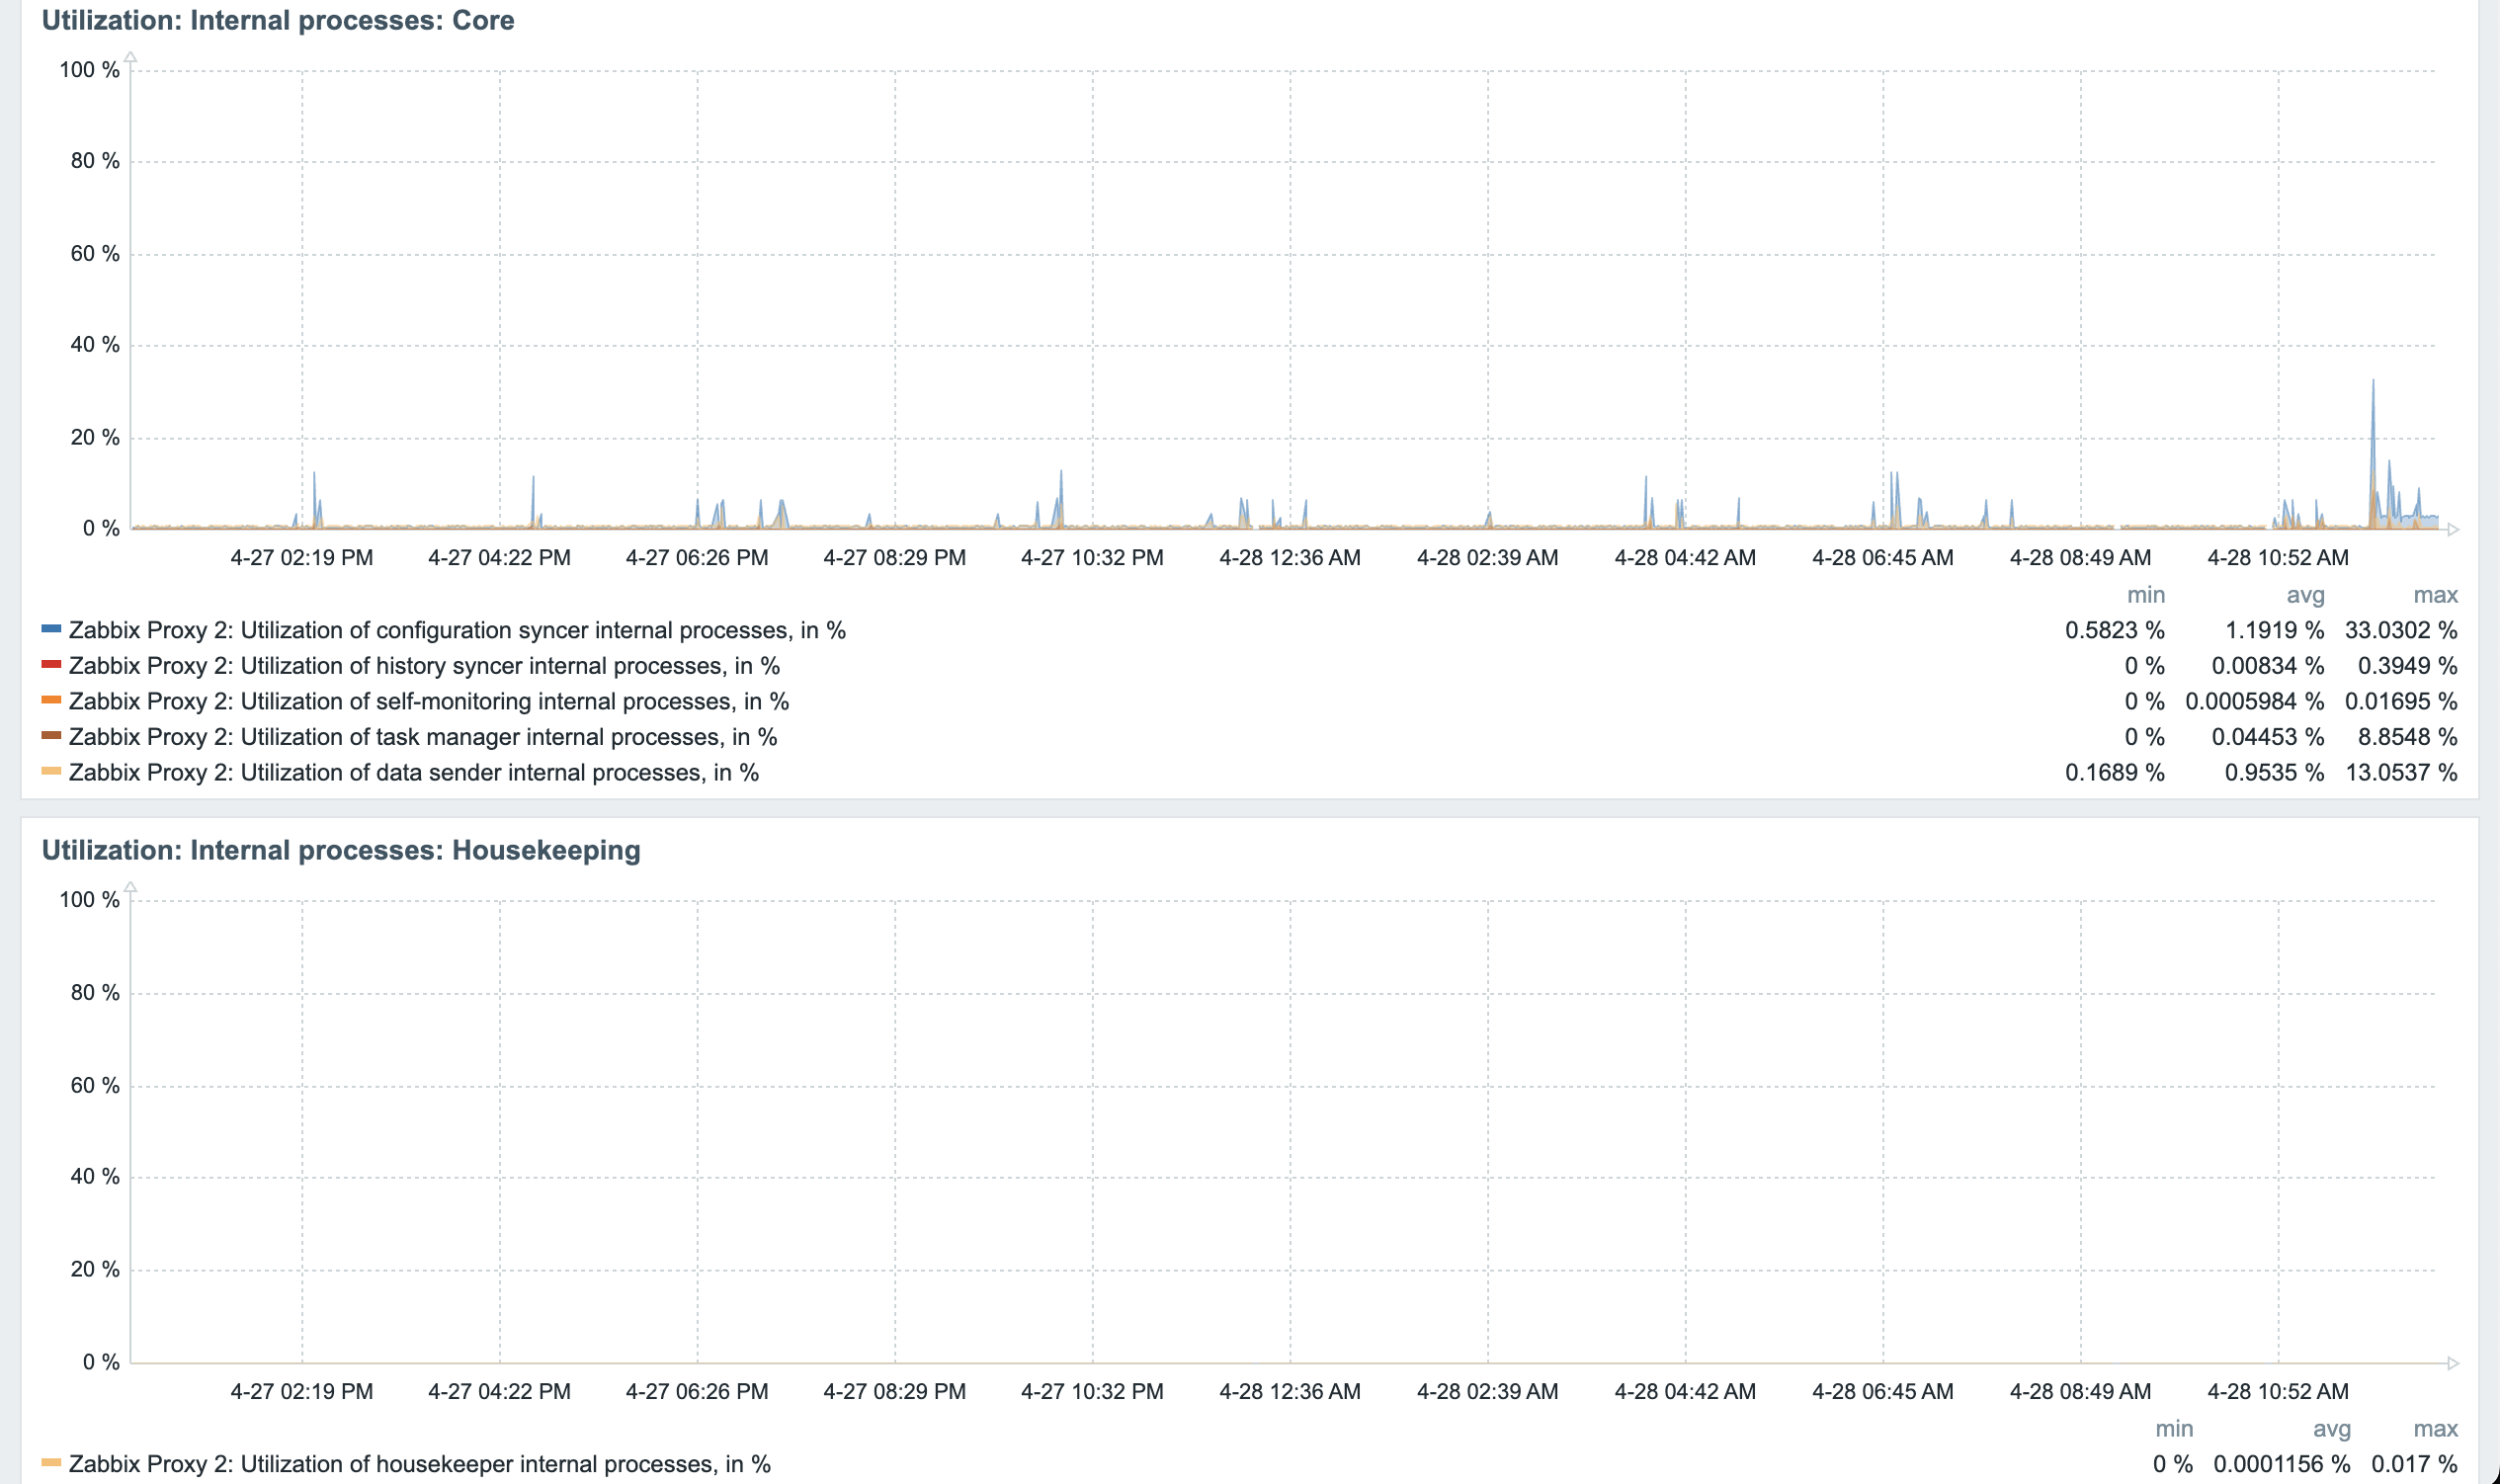
im monitoring both the server and proxy and no problems , but sometimes the preprocessing manager and worker utilization hits 99% but the it decreases and the queue is getting cleared.
Also i dont see any problems arising on the zabbix server
Expected:
- Resource metrics should update continuously according to the update interval.
- CPU utilization should not spike abnormally given available node resources.
- Newly created Kubernetes resources should be discovered and shown without needing to restart the proxy pod.