-
Type:
Defect (Security)
-
Resolution: Cannot Reproduce
-
Priority:
 Trivial
-
None
-
Affects Version/s: 7.0.13, 7.2.7, 7.4.0beta2
-
Component/s: Templates (T)
-
None
-
Environment:Ubuntu Server 24.04, Kubernetes v1.31.9, Zabbix 7.0, 7.2. 7.4beta, Kubernetes Helm from Zabbix Official site.
Steps to reproduce:
- Fresh install of Zabbix 7.0 or 7.2 or 7.4beta on Linux Ubuntu 24.04 Virtual Machine
- Fresh install of Zabbix Helm on Kubernetes v.1.31.9
Result:
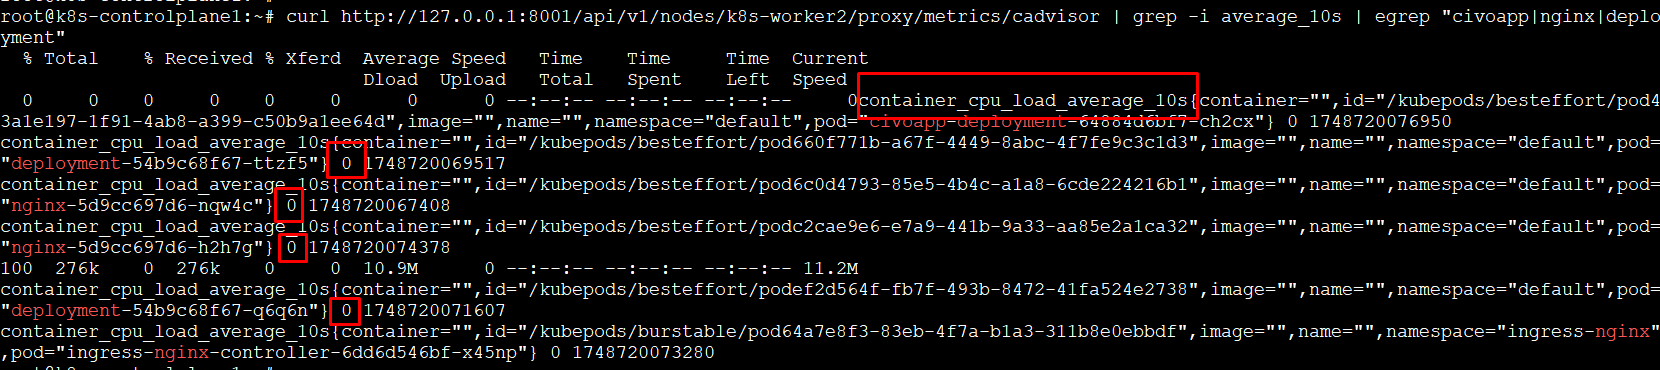
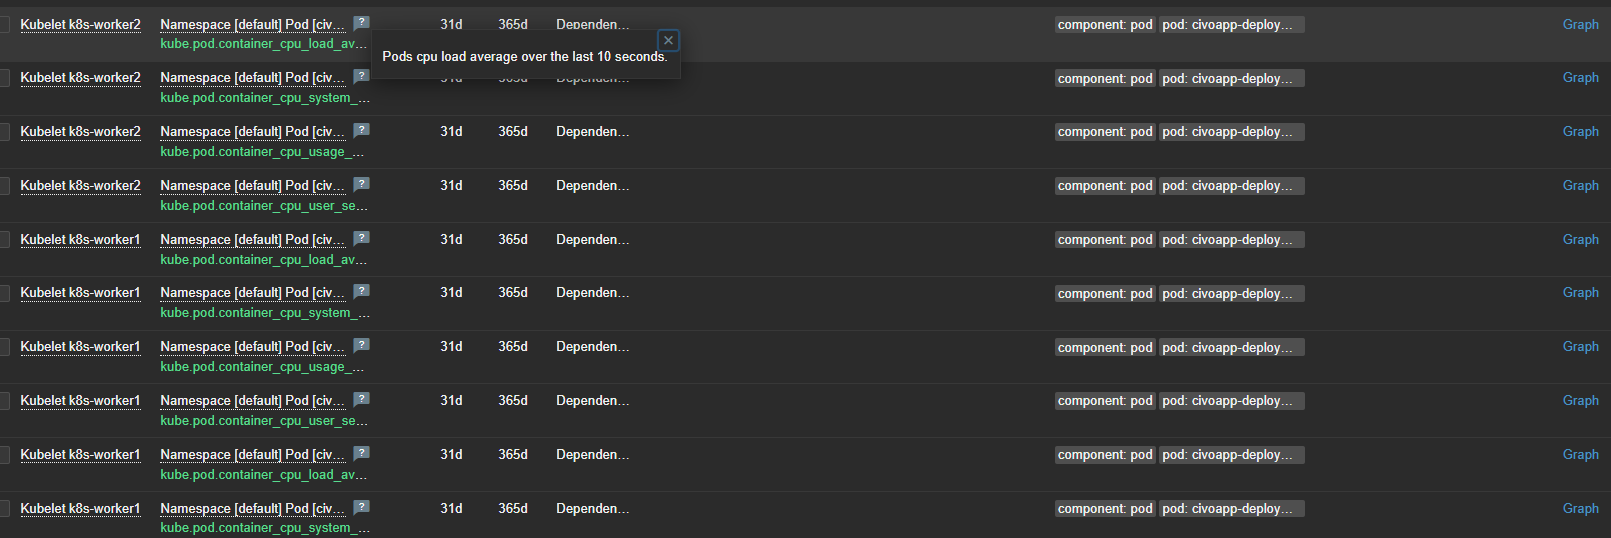
I installed the Zabbix Kubernetes Templates but the all the Pods cpu load average over the last 10 seconds are coming null or zero.
See screenshots. The metric name is container_cpu_load_average_10s
**
Expected:
Expected results are cpu metrics but returns 0 to all pods on all Kubernetes Nodes.
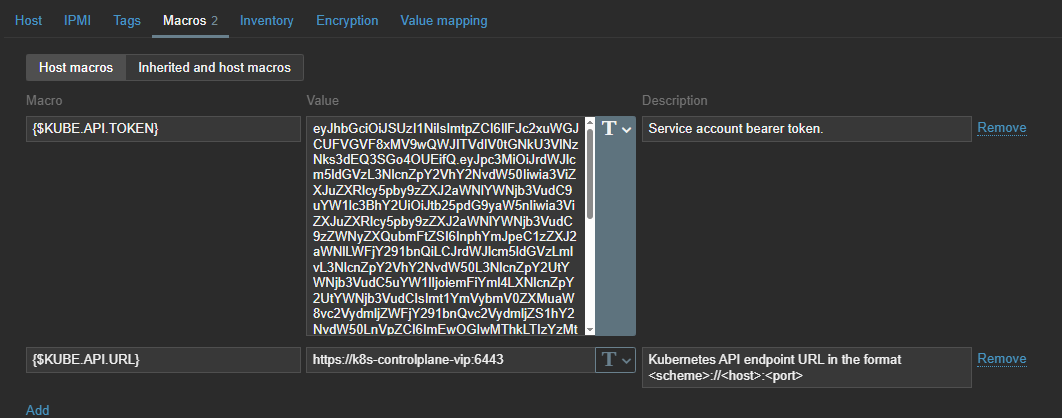
On macros, I put the API URL and Token. For the others, default values, no changes.
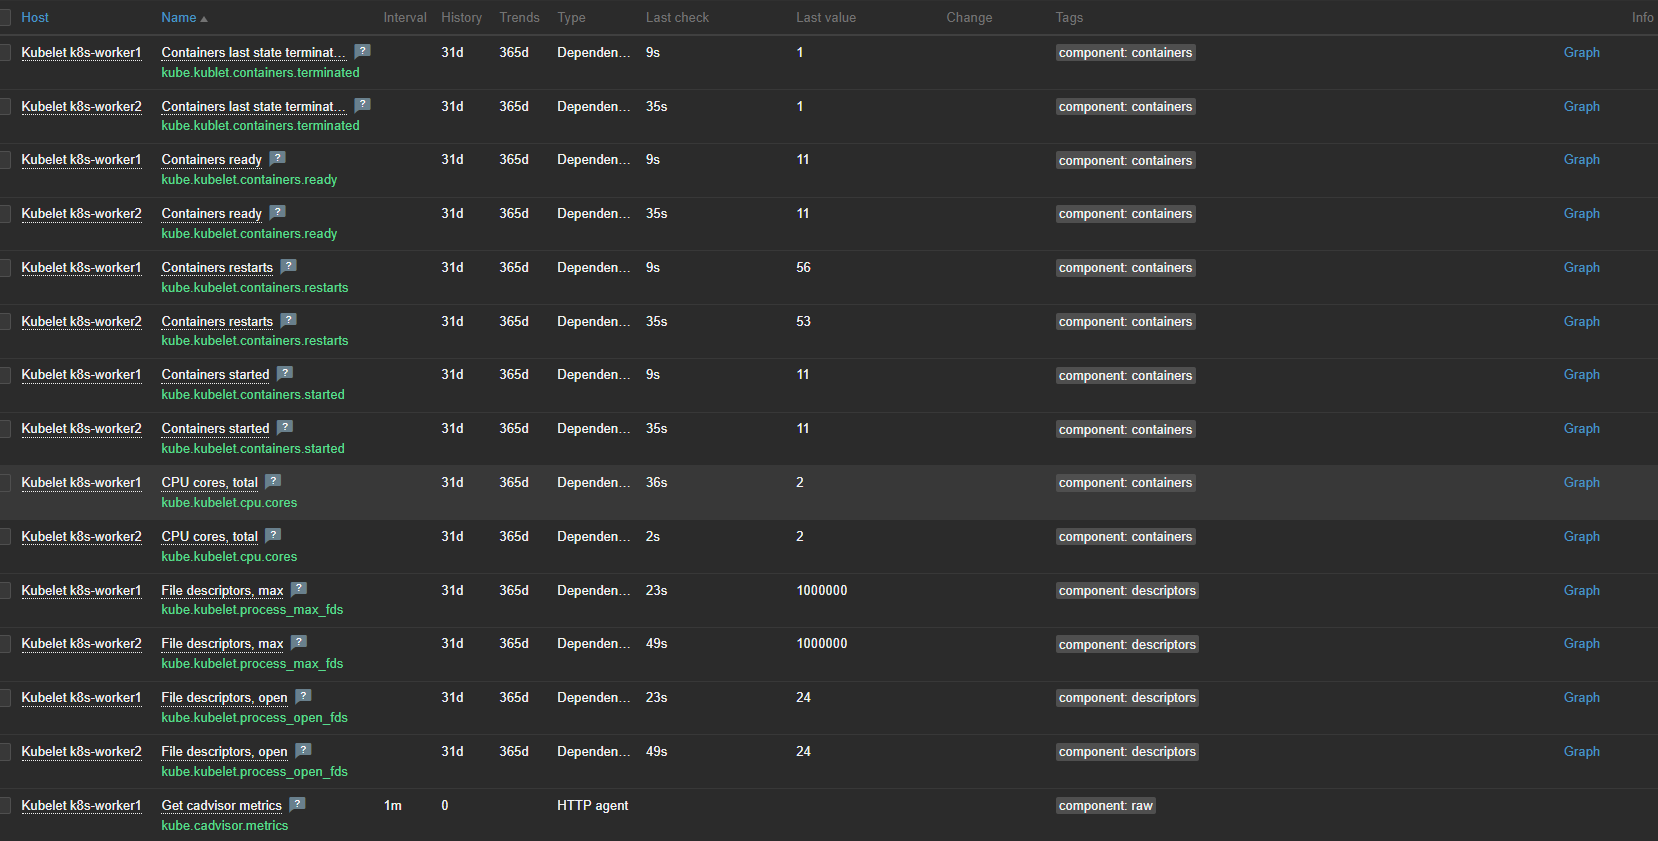
Others metrics are fine.
Maybe I'm doing some mistake or anything is not configured.